Tag

Juno

Browsing

The Solar Wind Crashes Into Jupiter a Few Times Every Month: Shocking Space Weather Explained

Solar wind interactions with Jupiter’s vast magnetosphere create extreme heating events and dramatic auroral displays, providing new insights into space weather phenomena and planetary behavior.

Summary

  • Solar wind bursts compress Jupiter’s magnetosphere, triggering high-temperature hot spots.
  • Repeated impacts occur several times each month on the giant planet.
  • Observations combine data from the Juno spacecraft and Earth-based telescopes.
  • Increased auroral energy is redirected from the poles toward the equator.
  • Comparative studies suggest similar impacts may affect other gas giants.
  • Models developed from these studies will help forecast solar storm impacts.
  • New research improves our understanding of planetary magnetospheres.
  • The phenomena challenge previous assumptions about Jupiter’s atmospheric stability.
  • Insights gained are applicable for protecting Earth-based technologies.
  • Scientific collaboration paves the way for future space weather research.

Introduction

The solar system is a dynamic place with many surprising interactions. One such interaction involves the solar wind—a constant stream of charged particles from the Sun—and Jupiter, the largest planet in our neighborhood. Recent research reveals that the solar wind crashes into Jupiter’s magnetic field multiple times every month. These high-energy impacts not only raise the temperature of certain regions on Jupiter but also trigger exceptional auroral displays. This article explains how these events occur, the science behind them, and what they mean for our understanding of space weather.

The Dynamics of Solar Wind and Jupiter

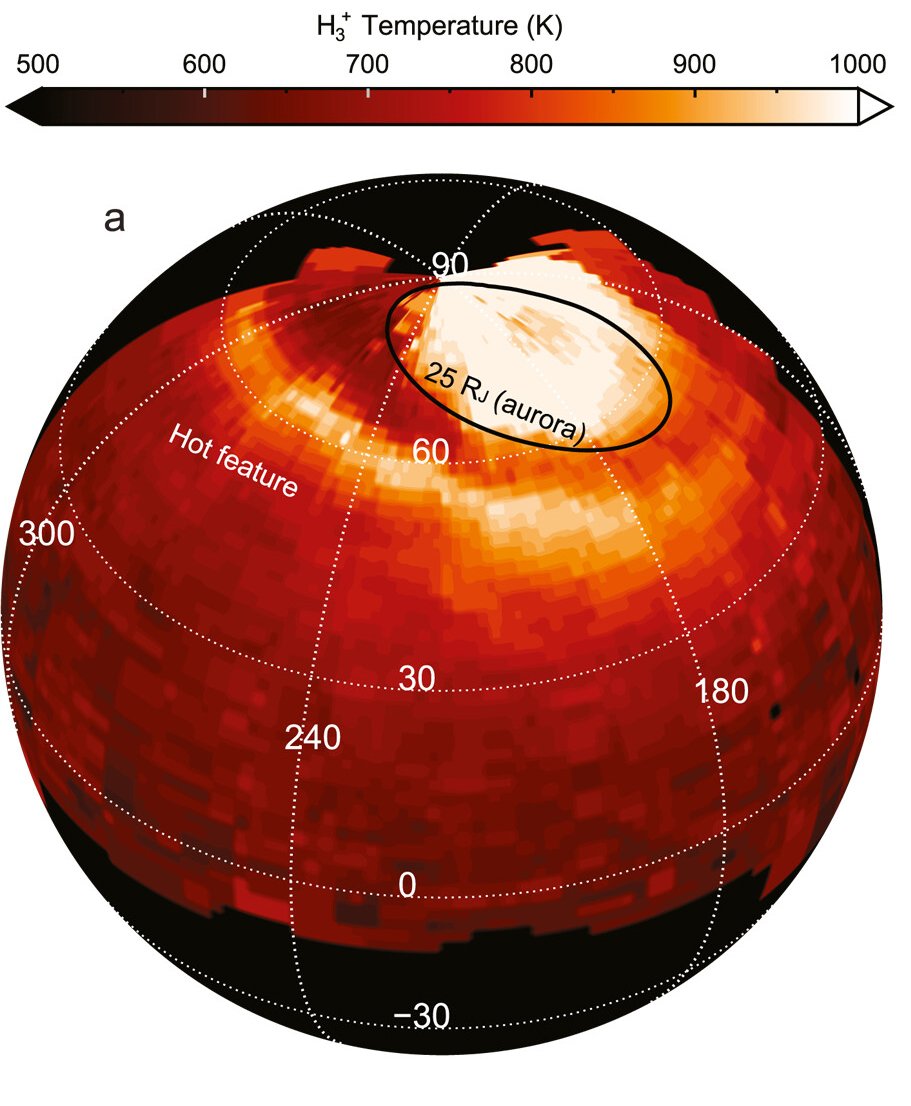
Jupiter is known for its enormous size and strong magnetic field. When the solar wind hits Jupiter, it compresses the planet’s magnetosphere, causing dramatic changes in its atmosphere. During these collisions, charged particles slam into the magnetic shield, creating hot spots with temperatures that can exceed 500°C. Such events challenge our previous ideas about the uniformity of Jupiter’s atmospheric temperature and show that the planet is far more dynamic than once believed.

Advanced instruments and spacecraft have made it possible to observe these interactions in detail. The data collected from missions such as the Juno spacecraft and observatories like Keck Observatory have been critical in identifying and understanding the impact of solar wind on Jupiter’s atmosphere.
The Solar Wind Crashes Into Jupiter a Few Times Every Month Shocking Space Weather Explained (1)
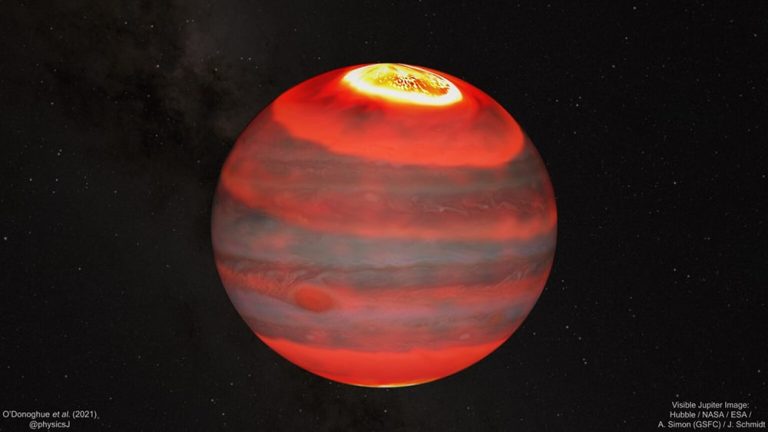
A map that shows Jupiter has a hot spot under its poles. Image provided by O’Donoghue and others.

Observations and Data Collection

Scientists have turned to both space-based and ground-based observations to gather extensive data on Jupiter’s space weather. For instance, telescopic images capture Jupiter’s vibrant aurorae, while readings from the Juno spacecraft provide clues about magnetic field compressions and temperature spikes. A detailed study published in a scientific journal noted that these temperature surges occur as a direct result of solar wind impacts, challenging previous atmospheric models.

Parameter Jupiter Saturn
Diameter 139,820 km 116,460 km
Magnetosphere Size Extremely vast Large, yet smaller
Solar Impact Rate Several times per month Rare, occasional impacts

The extensive dataset reveals that the impact of the solar wind on Jupiter is not a rare event, but a recurring phenomenon that forces charged particles deep into the planet’s upper atmosphere. These particles collide with atmospheric atoms and molecules, energizing them to create brilliant auroral light shows that extend far beyond the polar regions.

Scientific Insights and Theories

The recurring nature of these solar wind impacts has led scientists to develop new theories about the behavior of Jupiter’s magnetic environment. One leading idea proposes that the solar wind compresses the magnetosphere so intensely that it intensifies local auroral heating. Normally, Jupiter’s poles are warmer because of the magnetic field concentration. However, when the solar wind impacts, the energy disperses more widely across the atmosphere, warming regions closer to the equator.

Understanding Magnetospheres

The study of magnetospheres is not just about understanding planetary conditions but also about preparing for the impact of space weather closer to home. A magnetosphere is a protective magnetic bubble that surrounds a planet. In the case of Earth, our magnetosphere deflects harmful charged particles from the solar wind. However, when the solar wind is strong enough, even Earth’s protective shield can be temporarily overwhelmed—causing phenomena such as auroras, satellite disruptions, and even power grid failures.

Jupiter’s magnetosphere, being much larger, provides a unique perspective. Its reactions to solar wind impacts are more pronounced and varied, offering scientists a grand natural laboratory to study the physical processes involved in magnetic field interactions. Moreover, the study of Jupiter helps refine the models used to predict space weather events that affect all the planets, including our own.

Comparative Planetary Analysis

Comparing Jupiter’s responses to those of other planets deepens our understanding of space weather. Although Saturn and Uranus also experience solar wind impacts, the extent and frequency differ. Saturn’s magnetosphere, for instance, receives solar wind hits less frequently and shows different auroral characteristics compared to Jupiter. Detailed comparisons, such as the one in the table above, highlight these differences and suggest that each planet responds uniquely based on its size, magnetic strength, and atmospheric composition.

Observation Earth’s Response Jupiter’s Response
Temperature Change Mild to moderate fluctuations Extreme hot spot formation
Auroral Activity Displays as northern/southern lights Enormous and extended aurorae
Impact on Technology Satellite and grid disruptions Valuable data for model improvements

Studying these differences not only enhances our scientific knowledge but also assists in preparing space agencies for future missions. The data gathered from Jupiter, in particular, enriches our predictive models and helps inform the design of spacecraft that must withstand intense solar activities.

Solar weather events affect more than just the planets; they have real consequences for human technology and safety. On Earth, intense solar storms are known to interfere with satellite communications, disrupt power supplies, and affect navigation systems. The insights gleaned from Jupiter’s solar wind impacts are leading to improved forecasting and mitigation strategies. With better predictions, engineers can design more resilient systems to protect satellites and power grids from unexpected solar events.
The Solar Wind Crashes Into Jupiter a Few Times Every Month: Shocking Space Weather Explained
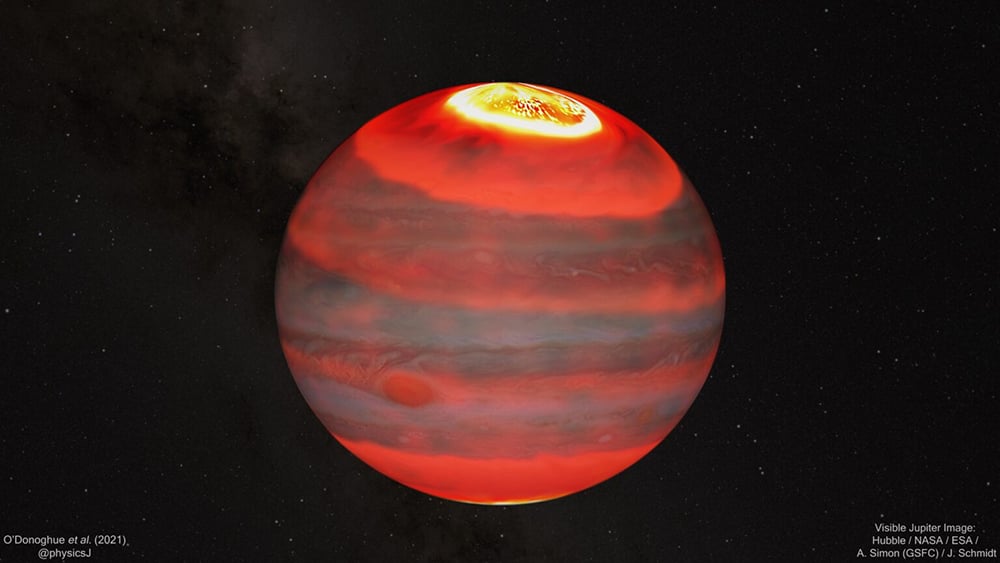
Heat moves from the top and bottom of Jupiter toward the middle. A new hot area shows something unusual is happening there. Picture of Jupiter provided by NASA/ESA/STScI.

Furthermore, astronauts venturing beyond Earth’s protective atmosphere are highly vulnerable to solar radiation. Learning how space weather influences planetary environments helps in planning safer missions. Researchers are working on advanced warning systems and protective measures that could one day be used to safeguard human explorers on missions to Mars and other destinations.

The field of space weather research is rapidly evolving. New missions are planned to continuously monitor the solar wind and its impacts on various planets. Ongoing observations combined with advanced simulation models promise to revolutionize our understanding of the interactions between solar wind and planetary magnetospheres. This research not only benefits scientists but also has practical applications for improving space travel and protecting Earth’s technological infrastructure.

Collaborative efforts between international space agencies and research institutions are essential to drive progress forward. As the technology improves, we can expect more detailed and frequent data collection, which will ultimately lead to more precise forecasting models. With every new discovery, we get closer to solving the mystery of how solar wind affects not just Jupiter, but all the bodies in our solar system.

Facts about Jupiter and Solar Wind

Jupiter is not only the largest planet in our solar system, but it also spins rapidly—completing one rotation in about 10 hours. This rapid rotation contributes to the strong magnetic field that defines the planet. The solar wind, though invisible to the naked eye, is a mighty force that continually shapes the environment of every planet it touches. Despite its distance from the Sun, Jupiter experiences these intense bursts of energy, making it a key focus for space weather studies.

References

For additional details on these fascinating phenomena, please refer to the following resources:

Big Red Spot on Jupiter: A Historical Overview from the 1800s

Key Takeaways

Jupiter’s Great Red Spot (GRS) is a massive, long-lived storm larger than Earth. First observed in the 1600s, the GRS has a complex and debated history. The storm is an anti-cyclonic vortex with wind speeds exceeding 400 km/h. Historical records and modern simulations suggest the GRS we see today likely formed in the mid-1800s. New research combines historical data with computer simulations to explore the GRS’s formation mechanisms.

Summary

  • Jupiter’s GRS: A massive, iconic storm larger than Earth, observed since the 1600s.
  • First Observations: Early sightings by astronomers like Giovanni Cassini and others in the 1600s and 1700s.
  • Lost Track: The GRS wasn’t observed for 118 years until its reappearance in the mid-1800s.
  • Historical Records: Early drawings and observations provide valuable data on the GRS’s appearance and movement.
  • Modern Observations: Spacecraft like Voyager, Galileo, and Juno have provided detailed images and data.
  • Wind Shear: Jupiter’s atmosphere contains winds running in opposite directions, creating conditions for the GRS.
  • Simulations: Supercomputer simulations explore possible formation mechanisms of the GRS.
  • Conclusion: The GRS likely formed from a South Tropical Disturbance (STrD) around the mid-1800s, acquiring its current form over time.

The Great Red Spot on Jupiter: How It Probably Formed in the Early 1800s

Jupiter’s Great Red Spot (GRS) is one of the most fascinating and enduring features of our Solar System. This massive storm, larger than Earth, has been observed by astronomers for centuries, with its formation and longevity still a topic of debate. The GRS is an enormous anti-cyclonic storm, rotating counter-clockwise with wind speeds exceeding 400 km/h (250 mph). It’s a striking feature that has captivated humans since at least the 1800s, and possibly earlier. Understanding its history and formation requires a look at both historical observations and modern scientific research.

Early Observations of the Great Red Spot

The earliest observations of the GRS may date back to 1632 when a German Abbott used his telescope to observe Jupiter. Thirty-two years later, another astronomer reported seeing a large spot moving from east to west across the planet. By 1665, the renowned astronomer Giovanni Cassini examined Jupiter and noted the presence of a storm at the same latitude as the current GRS. Cassini and his contemporaries observed this storm continuously until 1713, referring to it as the Permanent Spot.

Despite these early records, the GRS disappeared from astronomical observations for 118 years, only to be rediscovered in 1831 by astronomer S. Schwabe. He observed a clear, oval structure at the same latitude, which many believe marks the first sighting of the current GRS. This gap in observations has led to questions about the continuity of the storm and its relation to the earlier Permanent Spot.

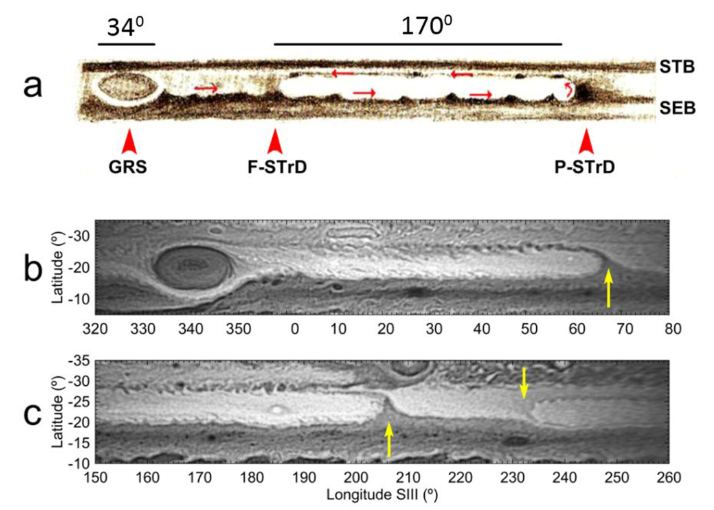
These images from the research show how the GRS formed. a is a drawing by T. E. R. Phillips in 1931–1932 of the STrD. The red arrows indicate the flow direction. The longitude scale is indicated. b and c are maps drawn from images taken by the New Horizons spacecraft. The yellow arrows mark position-velocity changes in the STrD. The STrD trapped winds. It created a long cell that generated the Great Red Spot. Image Credit: Sánchez-Lavega et al. 2024.

The Role of Historical Records

Historical records play a crucial role in understanding the GRS. Early drawings and descriptions by astronomers like Cassini provide valuable insights into the size, structure, and movement of the storm. However, interpreting these records is challenging due to the variable appearance of the GRS over time. Changes in size, albedo, and contrast with surrounding clouds have made it difficult to definitively link the Permanent Spot observed by Cassini with the current GRS.

A recent study in Geophysical Research Letters, led by Professor Agustín Sánchez-Lavega of the University of the Basque Country in Bilbao, Spain, attempts to bridge this gap. The research combines historical records with computer simulations to better understand the formation and evolution of the GRS.

Modern Observations and Technology

Modern technology has revolutionized our understanding of the GRS. Space telescopes and spacecraft have provided detailed images and data that were unimaginable in Cassini’s time. NASA’s Voyager 1 spacecraft captured the first detailed image of the GRS in 1979, revealing intricate wave patterns within the storm. Subsequent missions, including Galileo and Juno, have provided even more detailed observations.

Juno, in particular, has made significant contributions to our understanding of the GRS. Its close flybys of Jupiter have allowed scientists to capture high-resolution images and measure the depth of the storm. Juno’s instruments have shown that the GRS is relatively shallow, with a vertical extent of about 500 km, compared to its vast horizontal dimensions.

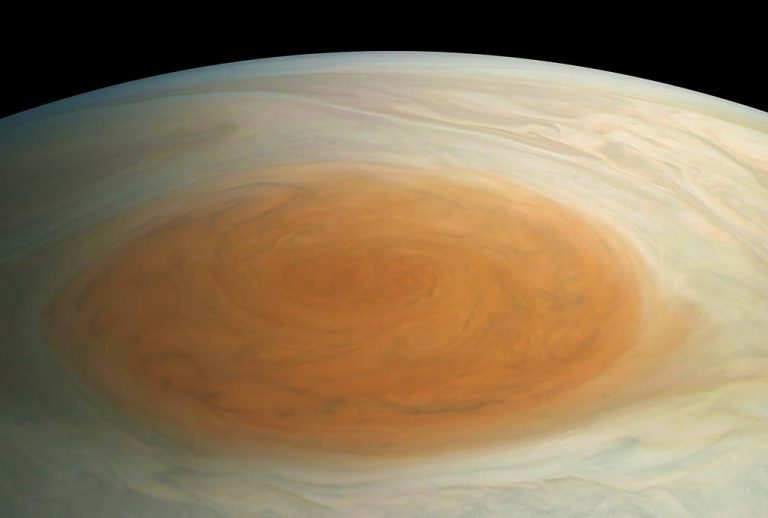
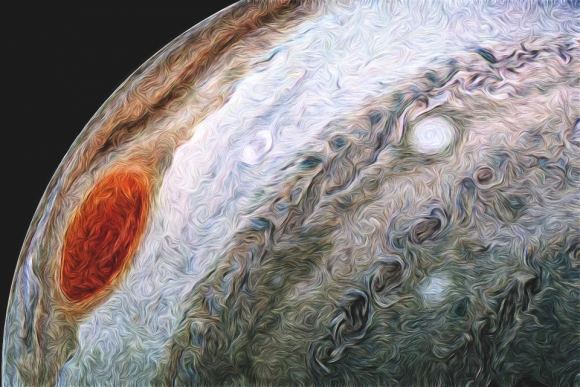
A new view of Jupiter and its GRS. Credit: NASA/SwRI/MSSS/Navaneeth Krishnan S © CC BY

The Mechanisms Behind the Great Red Spot

Jupiter’s atmosphere is characterized by powerful winds blowing in opposite directions at different latitudes. North of the GRS, winds blow westward at speeds of 180 km/h, while south of the storm, winds flow eastward at 150 km/h. This wind shear creates the conditions necessary for the formation and maintenance of the GRS.

Researchers have used supercomputer simulations to explore various mechanisms that could produce the GRS under these conditions. One hypothesis involves the eruption of a gigantic superstorm, similar to those observed on Saturn, while another suggests that smaller vortices created by wind shear merged to form the GRS. However, these simulations did not fully match the characteristics of the current GRS.

A New Hypothesis: The South Tropical Disturbance

A more promising explanation emerged from simulations involving the South Tropical Disturbance (STrD), an instability in Jupiter’s winds. The researchers found that the STrD could trap winds and create an elongated cell that eventually evolved into the GRS. This process likely began in the mid-1800s, when the GRS was much larger than it is today.

The simulations show that over time, the GRS would rotate more rapidly and become more compact as it shrank, eventually resembling the current storm. This hypothesis aligns with historical observations and modern data, suggesting that the GRS we see today is about 150 years old.

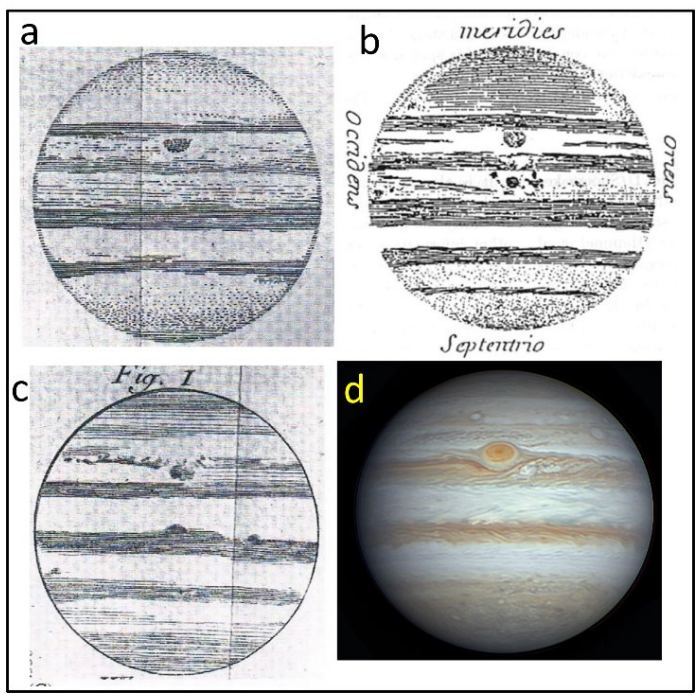
This research figure compares the Permanent Spot (PS) and today's GRS. a, b, and c are Cassini's drawings from 1677, 1690, and 1691. d is a 2023 GRS image. Image Credit: Sánchez-Lavega et al. 2024.
This research figure compares the Permanent Spot (PS) and today’s GRS. a, b, and c are Cassini’s drawings from 1677, 1690, and 1691. d is a 2023 GRS image. Image Credit: Sánchez-Lavega et al. 2024.

Detailed Analysis of Historical Observations

To support their hypothesis, the researchers analyzed historical records in detail. They compared drawings and descriptions of the Permanent Spot from the 1600s and 1700s with observations of the GRS from the 1800s onwards. They also examined photographs and telescopic images from the late 19th and early 20th centuries.

Table 1: Comparison of Historical Observations

Year Observer Description Notes
1665 Giovanni Cassini Large spot at GRS latitude Named it the Permanent Spot
1831 S. Schwabe Oval structure at GRS latitude First modern observation of the GRS
1879 A. A. Common Clear photograph of GRS Confirms presence of a large storm
1890 Observatory Lick Yellow filter photograph Detailed image showing GRS structure

These historical records provide a timeline of the GRS’s appearance and changes over the centuries. By comparing these records with modern observations, researchers can better understand the storm’s evolution.

Modern Spacecraft Observations

Spacecraft missions have been instrumental in studying the GRS. NASA’s Voyager 1 provided the first detailed image in 1979, revealing the storm’s complex structure. The Galileo spacecraft, which orbited Jupiter from 1995 to 2003, captured additional images and data. More recently, the Juno spacecraft has provided the most detailed observations yet, including measurements of the storm’s depth and high-resolution images.

Table 2: Key Spacecraft Observations

Spacecraft Year Key Observations
Voyager 1 1979 First detailed image of GRS
Galileo 1995-2003 Extensive imaging and data collection
Juno 2016-Present High-resolution images and depth measurements

These observations have provided critical data on the GRS’s structure, composition, and dynamics. They have also revealed changes in the storm over time, such as its shrinking size and increasing rotation speed.

The Future of GRS Research

As technology continues to advance, our understanding of the GRS will deepen. Future spacecraft missions and advanced telescopes will provide even more detailed observations, allowing scientists to study the storm in unprecedented detail. Additionally, improved computer simulations will help researchers test new hypotheses and refine existing models.

Conclusion

Jupiter’s Great Red Spot is a remarkable and enduring feature of our Solar System. Its formation and longevity have intrigued astronomers for centuries. By combining historical records with modern observations and simulations, researchers have developed a plausible explanation for the GRS’s formation in the mid-1800s. This iconic storm, with its swirling red clouds and powerful winds, continues to captivate scientists and the public alike.

Hashtags

#Jupiter, #GreatRedSpot, #Astronomy, #Space, #NASA, #Voyager, #Galileo, #Juno, #SpaceScience, #PlanetaryScience, #SolarSystem

Juno Discovers Massive Lava Lake on Io

Key Takeaway

Juno spacecraft’s close flybys of Jupiter’s moon Io revealed a giant lava lake called Loki Patera, providing detailed insights into the moon’s volcanic activity and surface features. Scientists also concluded that Io has been erupting volcanically since the early Solar System due to tidal heating.

Summary

  • Juno spacecraft made close flybys of Jupiter’s moon Io, revealing new details about its surface.
  • A giant lava lake named Loki Patera was observed, showcasing volcanic activity.
  • Juno captured images of Io’s northern latitudes, revealing its pizza-like appearance, caused by volcanic activity.
  • Io exhibits various surface features like volcanic plumes, lava flows, and calderas.
  • Scientists recreated features like “The Steeple,” a spired mountain on Io, using JunoCam data.
  • Recent papers concluded that Io has been erupting volcanically since the early Solar System due to tidal heating.
  • Observations with ALMA in Chile revealed isotopic evidence of long-lived volcanism on Io, indicating billions of years of tidal heating.
  • Juno will continue to explore Jupiter’s system, with its latest flyby of Io on April 9 and upcoming flyby on May 12.
  • JunoCam allows public participation in selecting imaging targets and processing data.

Exploring the Fiery Depths of Io

Jupiter’s moon Io has long fascinated astronomers and space followers alike with its otherworldly landscapes and intense volcanic activity. Recent revelations from NASA’s Juno spacecraft have further deepened our understanding of this mysterious moon, Revealing breathtaking details of its fiery surface and shedding light on its geological history.

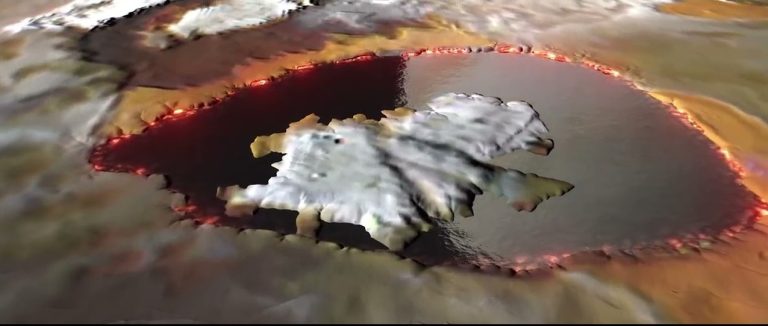
One of the most striking discoveries made by Juno is the observation of a massive lava lake known as Loki Patera. Stretching over 200 kilometers, this colossal lava lake is surrounded by islands within a depression filled with molten magma. Juno’s close flybys provided unprecedented views of this geological wonder, revealing a landscape reminiscent of Earth’s volcanic regions but on a grander scale.

Io’s surface shows its violent volcanic past. It is covered with vents, calderas, and lava flows. Juno’s sharp images reveal Io’s changing geology. They show bright plumes and complex designs formed by thousands of years of volcanic activity. Io has high mountains and wide lava plains. These features show the strong forces active below its surface.

Io has a unique mountain called “The Steeple.” It is very tall, standing between 5 and 7 kilometers high. This mountain shows how intense volcanic activity has formed Io’s surface for billions of years. Thanks to Juno’s observations, scientists can understand Io’s geological history. They learn how its volcanoes work.

Io’s volcanic activity comes from its special orbit around Jupiter. Its eruptions are caused by tidal heating. This heating happens because of gravity from Jupiter and its moons, Europa and Ganymede. Studies with data from ALMA show Io’s volcanoes have been active for billions of years. This activity has changed Io’s surface and atmosphere.

Juno’s mission continues to solve the mysteries of Io and the wider Jupiter system. With each close flyby, Juno gathers invaluable data that enhances our understanding of Io’s geology and its significance in planetary science. Furthermore, JunoCam invites the public to participate in this journey of exploration, allowing followers to engage with the mission and contribute to the study of Io’s volcanic landscapes.

Hashtags:

#Juno #Io #Volcanoes #SpaceExploration #PlanetaryScience #Astronomy #NASA #Jupiter #LavaLake #Geology #Astrophysics #Massive Lava Lake On Io
Pin It
error: Content is protected !!

This website utilizes first- and third-party tools that store small files (cookies) on your device. These cookies serve various purposes, including ensuring the site functions correctly (technical cookies), analyzing site usage (analytics cookies), and delivering relevant advertisements (profiling cookies). While technical cookies are essential and used by default, you have the option to enable or disable analytics and profiling cookies. By allowing these cookies, you help us enhance your browsing experience.