Tag

#globalwarming

Browsing

Satellites Track Alarming Sea Level Rise Impacting Pacific Islands

The threat of rising sea levels in Pacific Island nations, such as Tuvalu, Kiribati, and Fiji, is becoming a dire reality. NASA and other scientific organizations are utilizing satellite data to monitor and predict future sea level rise, helping to protect these vulnerable regions. The rise is primarily driven by climate change factors such as melting ice caps and warming oceans.

Summary

  • Rising sea levels are a significant threat to Pacific Island nations like Tuvalu, Kiribati, and Fiji.
  • Climate change, particularly the melting of glaciers and thermal expansion of oceans, is the main cause of sea level rise.
  • NASA and research groups use satellites to track sea levels and provide data for future predictions.
  • NASA’s Pacific Islands Flooding Tool is a key resource for understanding sea level projections.
  • Different emissions scenarios (best-case to worst-case) are considered in predictive models.
  • The islands could experience at least 15 cm of sea level rise by 2050.
  • High-tide flood days could increase from 5 to 25 annually for some islands, causing extreme disruptions.
  • Local conditions, such as coastlines and topography, influence how sea level rise impacts each region.
  • Ground-based measurements are scarce, limiting the full picture of sea level change.
  • Real-world experiences, such as king tides and saltwater intrusion, are already devastating the islands.
  • Scientific data is being used for early warning systems to protect communities.
  • Adaptation strategies include flood mitigation and resilience planning.
  • Satellite data is essential for global understanding and climate action efforts.
  • The future of Pacific Island nations depends heavily on global response to climate change.
  • Nations like Tuvalu are advocating for climate justice and international support.
  • Tools such as NASA’s Pacific Islands Flooding Tool play a crucial role in understanding future scenarios.

Main Article:

Small Pacific Island nations are among the first to face the consequences of rising sea levels due to climate change. Islands like Tuvalu, Kiribati, and Fiji stand at the frontlines of this global crisis, as they face the potential of being submerged by the ocean within the next 50 years. The cause? Sea level rise driven by climate change, and exacerbated by melting glaciers, the thermal expansion of seawater, and an increase in greenhouse gases. These changes pose an existential threat to millions of inhabitants whose very homes, cultures, and livelihoods are at stake.

NASA’s Role in Monitoring Sea Level Rise

NASA, in collaboration with leading research institutions, has been at the forefront of monitoring sea level changes. By using satellite data and sophisticated models, the agency is able to predict rising sea levels in various regions, particularly in the vulnerable Pacific Islands.

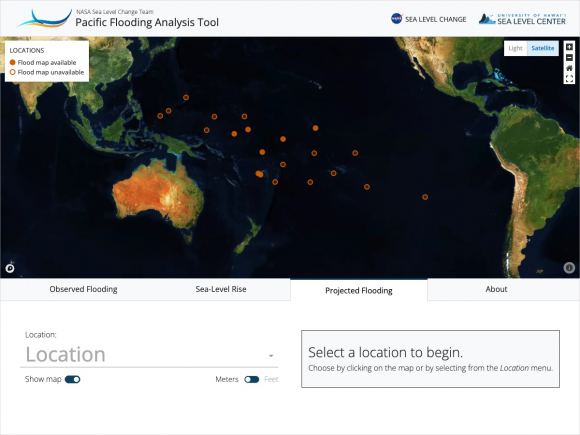
The Pacific Islands Flooding Tool, developed by NASA, is a groundbreaking resource. This tool allows scientists to assess the potential impacts of sea level rise on low-lying Pacific Islands. It provides high-resolution maps and predictive data to help these nations prepare for future flooding scenarios.

“Sea level will continue to rise for centuries, causing more frequent flooding,” says Dr. Nadya Vinogradova Shiffer, ocean physics expert at NASA. “NASA’s new flood tool tells you what the potential increase in flooding frequency and severity looks like in the next decades for coastal communities of the Pacific Island nations.”

Satellites Track Alarming Sea Level Rise Impacting Pacific Islands
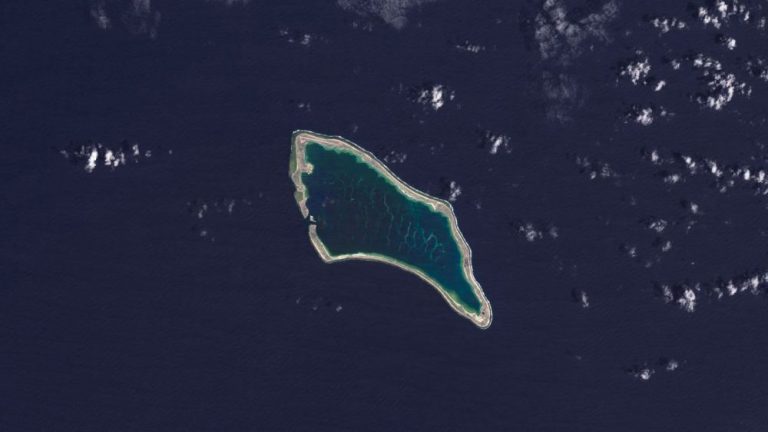
Tuvalu is made up of several islands. Rising sea levels pose a significant threat to these islands. Scientists predict that the sea could cover the islands within 50 years. This information comes from NASA.

How Sea Levels Are Measured

Sea level monitoring relies on a combination of ground-based and satellite-based technologies. NASA, along with universities such as the University of Hawaii and Virginia Tech, uses a variety of tools to measure sea levels, including:

  • Satellites: Orbiting satellites such as TOPEX/Poseidon and Jason-3 provide critical data on sea levels across the globe.
  • Ship-based measurements: Instruments on board research vessels collect sea-level data while traversing the ocean.
  • Supercomputer analysis: Advanced models process the vast amounts of data collected to predict future sea levels.

These measurements, along with data from tide gauges on the ground, help scientists create models that can predict how sea levels will rise in the coming decades.
Satellites Track Alarming Sea Level Rise Impacting Pacific Islands
The portal to NASA’s Pacific Islands flooding analysis tool to help scientists assess sea level rise in low-lying areas. Courtesy NASA.

Table 1: Key Satellite Systems Monitoring Sea Levels

Satellite Name Primary Function Launch Date Data Collected
TOPEX/Poseidon Sea level monitoring 1992 Global sea levels
Jason-1 Continuation of TOPEX/Poseidon mission 2001 Sea level, ocean circulation
Jason-3 High-precision ocean altimetry 2016 Global sea surface height
SWOT Surface Water and Ocean Topography 2022 Freshwater bodies, ocean levels

Impact on Pacific Island Nations

How severe is the threat? The NASA-led study reveals that the Pacific Islands could see a sea level rise of at least 15 centimeters by 2050. This may not seem like much, but for island nations where the highest elevation is just a few meters above sea level, it’s a disaster in waiting.

  • Tuvalu currently experiences fewer than five high-tide flood days each year. By 2050, that number could rise to 25.
  • Kiribati may face as many as 65 high-tide flood days annually within the same time frame.

This will have devastating effects on infrastructure, agriculture, and daily life. Coastal erosion, flooding, and saltwater intrusion into freshwater supplies are just some of the immediate threats.

“I am living the reality of climate change,” says Grace Malie, a youth leader from Tuvalu involved in the Rising Nations Initiative. “Everyone lives by the coast, so everyone gets heavily affected by this.”

Table 2: Projected Sea Level Rise for Pacific Islands by 2050

Island Nation Current Annual Flood Days Projected Annual Flood Days (2050)
Tuvalu 5 25
Kiribati 10 65
Fiji 8 30
Marshall Islands 7 45

Real-World Consequences of Rising Sea Levels

For Pacific Island nations, the future is becoming increasingly uncertain. The impacts of sea level rise go beyond simple flooding:

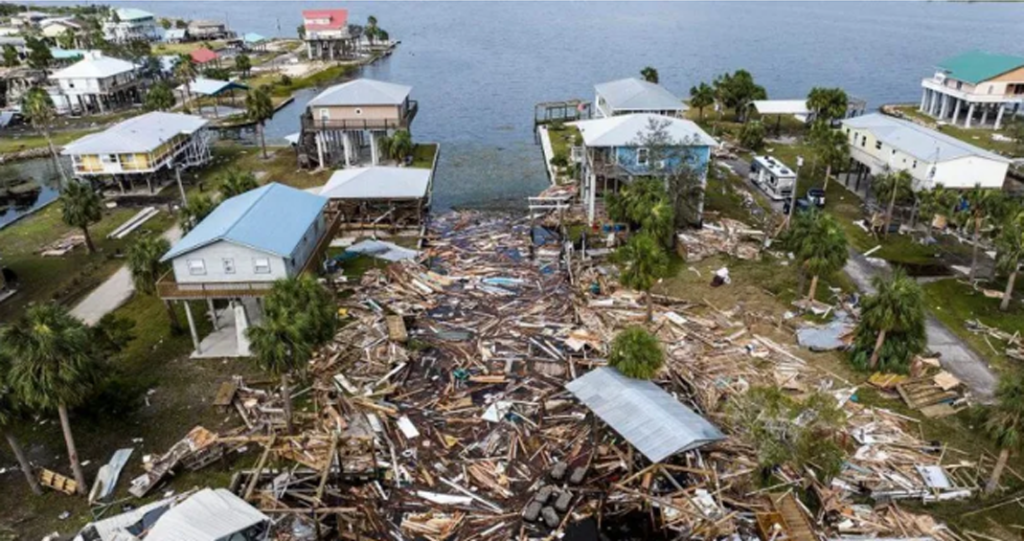
  • King Tides: These exceptionally high tides are already causing flooding in many Pacific Islands. As sea levels rise, these tides will become more frequent and destructive.
  • Saltwater Intrusion: Rising seas cause saltwater to penetrate underground water sources, contaminating freshwater supplies. This impacts agriculture, drinking water, and the natural ecosystem.
  • Erosion: Coastal erosion is another significant threat. As shorelines recede, infrastructure and homes are lost to the ocean.

Grace Malie adds, “There are points on the island where we will see seawater bubbling from beneath the surface and heavily flooding the area.”
Satellites Track Alarming Sea Level Rise Impacting Pacific Islands

Adapting to the Future

Despite the grim predictions, Pacific Island nations are taking steps to mitigate the impact of rising sea levels. With the help of satellite data, they are implementing flood mitigation strategies and investing in resilience-building projects. NASA’s data is critical in shaping these strategies.

Some nations are even exploring the possibility of relocating entire communities to higher ground or neighboring countries. This is a drastic step but may be the only option if sea levels continue to rise.

“The future of the young people of Tuvalu is already at stake,” Malie explains. “Climate change is more than an environmental crisis. It is about justice, survival for nations like Tuvalu, and global responsibility.”

The fight against rising sea levels is not just a local issue for Pacific Island nations; it is a global challenge. The continued rise of greenhouse gas emissions will exacerbate the problem. Satellite data is vital for understanding these changes and helping vulnerable nations adapt. However, real solutions require a global effort to reduce emissions, slow the melting of glaciers, and address climate change on a broad scale.

As Pacific Island nations struggle to survive, the world must come together to ensure they have the tools and support they need. The rising seas are a clear sign that time is running out.

References

#SeaLevelRise, #ClimateChange, #PacificIslands, #NASA, #RisingSeas, #SatelliteMonitoring, #Tuvalu, #Kiribati, #Flooding, #OceanLevels, #ClimateCrisis, #GlobalWarming, #KingTides, #SaltwaterIntrusion, #EnvironmentalJustice

The Sahara Desert Turns Green After Unusual Rainfall: A Rare Transformation

The Sahara Desert, one of the driest regions on Earth, recently experienced unusual heavy rainfall, leading to a brief greening in parts of the desert. The transformation occurred after an extratropical cyclone in September brought significant rainfall to areas in Morocco, Algeria, Tunisia, and Libya. Climate change and the northward shift of the Intertropical Convergence Zone (ITCZ) are suspected to be key factors behind this rare event. While vegetation emerged, the rains also caused devastating floods, affecting millions of people across 14 African countries. This greening event, although temporary, mirrors a time over 5,000 years ago when the Sahara was covered with lakes and vegetation.

Summary of Events

  • Sahara’s unusual greening after a rare rainfall event.
  • NASA satellite images revealed plant life sprouting in desert areas.
  • Cyclone-induced rainfall was the cause of the sudden transformation.
  • Flooding resulted from the torrential rains, affecting large populations.
  • Climate change and a shifting rain belt (ITCZ) are believed to be causes.
  • Brief vegetation period in the Sahara was a rare but significant event.
  • Connection to ancient history, when the Sahara was once green thousands of years ago.

The Sahara Desert’s Rare Green Transformation

The Sahara Desert, widely known as the largest hot desert on Earth, covering an area roughly the size of the United States, is typically characterized by its barren, arid landscape and vast expanses of sand dunes. However, in a stunning turn of events, parts of the Sahara Desert have unexpectedly turned green after an unusual episode of heavy rainfall.

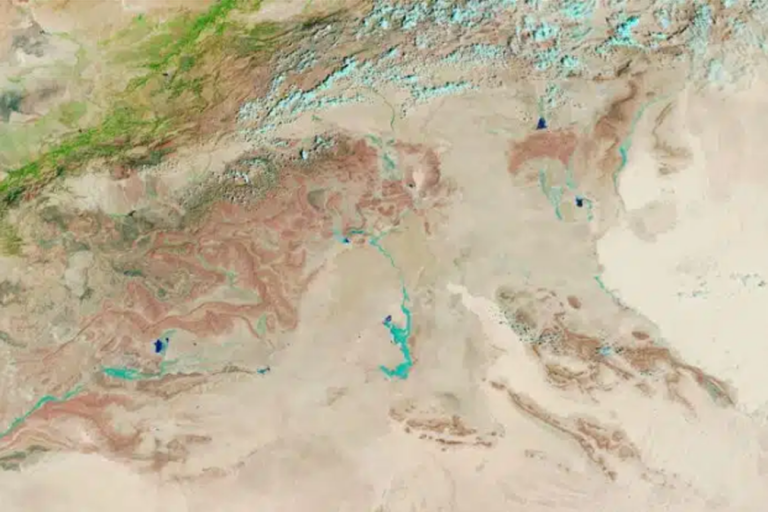
This rare transformation has caught the attention of scientists worldwide, as NASA’s satellite images have revealed patches of vegetation emerging in typically dry regions such as Morocco, Algeria, Tunisia, and Libya. While this greening is temporary, it has raised questions about climate change and the shifting patterns of weather affecting the planet.

Why Did the Sahara Turn Green?

The Sahara Desert’s greening is the result of an extratropical cyclone that struck northwestern Africa on September 7th and 8th. This storm brought over half a foot of rain to certain areas, a phenomenon virtually unheard of in the desert. Such rainfall, coupled with the desert’s unique ability to respond to brief wet conditions, allowed vegetation to sprout in areas typically devoid of life.

The Intertropical Convergence Zone (ITCZ) is a key player in this rare event. This tropical rain belt, which is normally associated with heavy rains in equatorial regions, shifted unusually far north this year. It’s this northward movement of the ITCZ that resulted in torrential rains over the Sahara.

Moshe Armon, a senior lecturer at the Institute of Earth Sciences at the Hebrew University of Jerusalem, remarked on the uniqueness of this event, saying:

While some degree of rainfall occurs in the Sahara every summer, the involvement of an extratropical cyclone made this year’s event particularly rare.

Scientists have theorized that global climate change may have played a role in pushing the ITCZ further north than usual. With the Northern Hemisphere experiencing more warming than the Southern Hemisphere, the resulting temperature imbalance could have nudged the ITCZ northward, bringing rain to regions like the Sahara.

Francesco S.R. Pausata, an atmospheric science professor at the University of Quebec in Montreal, explained:

The Northern Hemisphere, having more land than the Southern Hemisphere, tends to warm up more, which could lead to a northward push of the ITCZ.

For many people living near the desert, seeing the Sahara green, even for a short period, is a rare and awe-inspiring event. The NASA Earth Observatory images clearly show shrubs and grasses sprouting in riverbeds and low-lying areas where water could accumulate. These plants take advantage of brief rainfall events, turning otherwise dry sand dunes into vibrant green landscapes.

However, this event, while extraordinary, also came with devastating consequences for parts of Africa. While rain fell mostly in sparsely populated desert regions, floods wreaked havoc in areas of 14 different African countries. More than 1,000 people died, and millions were affected by infrastructure damage, road destruction, and disruption to electricity and water supplies.

The World Food Programme and the Associated Press reported that these floods posed significant challenges for aid organizations attempting to provide relief in affected areas. Roads were impassable, and aid could not easily reach those in need.

Table 1: Countries Impacted by Flooding

Country Number of People Affected Infrastructure Damage
Mauritania 250,000 Roads, Electricity
Mali 300,000 Roads, Water
Niger 400,000 Roads, Power Lines
Chad 500,000 Water Supply, Roads
Sudan 600,000 Electricity, Roads

History Repeating: The Sahara Was Once Green

Interestingly, this is not the first time the Sahara Desert has experienced greening. Between 11,000 and 5,000 years ago, the Sahara was a much wetter place, covered in vegetation, lakes, and rivers. This period, known as the “African Humid Period,” was caused by changes in Earth’s orbit that brought more rain to the region. The recent rainfall event, while temporary, harkens back to that ancient time when the desert was teeming with life.

According to NASA’s Earth Observatory, it’s possible that increased rainfall in the future could lead to more frequent and longer-lasting greening events in the Sahara. However, experts caution that these events are likely to be brief and sporadic, tied closely to the unpredictable nature of climate change and shifting weather patterns.

Table 2: Climate Events Affecting the Sahara Over Time

Time Period Climate Condition Sahara’s State
11,000 – 5,000 years ago African Humid Period Green, Lush Vegetation
2,000 – Present Desertification Dry, Arid
2024 (current event) ITCZ Shift Brief Greening

The greening of the Sahara Desert, while remarkable, is expected to be temporary. The region is likely to return to its arid state as the ITCZ shifts back southward and the rain dries up. However, the implications of this event for the future are significant. Climate scientists are now watching closely to see if similar events will happen more frequently as global temperatures continue to rise.

If these weather patterns persist, the Sahara could see more periods of rainfall, which could have both positive and negative consequences. On one hand, greening could bring temporary agricultural opportunities and increased biodiversity to the region. On the other hand, it could also lead to more devastating floods and challenges for the people living in the surrounding areas.

#SaharaGreen, #ClimateChange, #RainInSahara, #ITCZShift, #UnusualWeather, #GlobalWarming, #GreenSahara, #NASA, #AfricaFloods, #RareEvent, #Rainfall, #Vegetation, #SaharaTransformation, #ClimatePatterns, #EnvironmentalChange

The Biggest Project in History: 52 Billion Solar Panels Covering America

Researchers from prominent institutions have proposed the installation of 52 billion solar panels across America’s highway network, capable of generating 60% of global electricity consumption. This monumental project aims to reduce carbon emissions and traffic losses, with groundbreaking possibilities for a greener, more sustainable future.

Summary

  • Proposal from leading global universities to cover highways with solar panels.
  • 52 billion solar panels could generate 60% of the world’s electricity demand.
  • The initiative is expected to offset 28% of global carbon emissions.
  • Potential to reduce road accidents by 11%.
  • The project faces challenges like high construction costs and maintenance.
  • Variations in climate conditions could affect solar panel efficiency.
  • The project could pay off its carbon footprint within 1.1 years.
  • The idea is groundbreaking but still in exploratory stages.
  • Pilot projects have been implemented in the US, China, and Europe.
  • The project could deliver 4 times the amount of energy currently produced in the US.
  • Green energy is becoming more feasible with increasing technological advancements.
  • Existing infrastructure, such as highways, can be repurposed to reduce the environmental footprint.
  • Innovative solutions are crucial for a sustainable future.
  • The solar highway could serve as a catalyst for global renewable energy expansion.
  • Economic costs and logistical challenges need to be addressed for successful implementation.

The Vision of Solar-Powered Highways

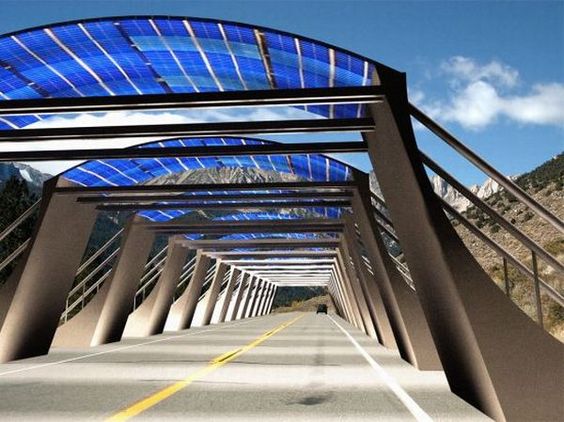
Imagine driving on an American highway and knowing that the road beneath your wheels is helping power the world. A team of researchers from the Chinese Academy of Sciences, Tsinghua University, Chinese Academy of Geosciences, and Columbia University has proposed a visionary plan: installing 52 billion solar panels to cover the American highway network. This ambitious project, detailed in the paper Roofing Highways with Solar Panels Substantially Reduces Carbon Emissions and Traffic Losses, could revolutionize how we generate energy, drastically cutting global carbon emissions and creating an unprecedented renewable energy source.

This project is not just a dream. It is an exploratory initiative already seeing pilot projects in countries like the United States, China, Germany, and Switzerland. The potential impact of this plan is staggering — generating more than 17,500 TWh of electricity annually, or about 60% of the world’s 2023 energy consumption. Could this be the key to a green future?

How 52 Billion Solar Panels Could Change the World

The global highway network covers 3.2 million kilometers. This creates a huge amount of space that we could use to generate solar energy. Researchers believe that placing solar panels along these highways could make a big difference. It could produce enough energy to reduce 28% of global carbon emissions. This would greatly help in the battle against climate change.

The numbers are compelling. The paper estimates that the solar highways would generate 17,578 TWh of electricity annually, equating to more than 60% of the global energy demand in 2023. This renewable energy source would offset approximately 28% of the world’s carbon emissions, a game-changing statistic in the push for climate action.

In addition to providing green energy, the solar highways could also play a role in reducing road accidents. The reflective nature of solar panels can improve visibility on the roads, potentially lowering traffic incidents by 11%. This would not only save lives but also reduce the economic costs associated with traffic accidents.

Table 1: Potential Benefits of Solar Highways

Benefit Impact
Global energy consumption 60% covered
Reduction in carbon emissions 28% offset
Decrease in traffic accidents 11% reduction
Annual electricity generation 17,578 TWh

Challenges: What Could Hold the Project Back?

While the idea of solar highways is exciting, several challenges could hinder its implementation.

1. Climate Variations

The efficiency of solar panels is largely dependent on climate conditions. Areas with less sunlight will generate less energy, and certain regions may not produce enough to justify the cost of installation.

2. Economic Costs

The initial construction cost of the solar highway project is estimated to be enormous. Regular maintenance would also be required to keep the panels functioning efficiently, adding to the long-term costs.

3. Carbon Footprint of Construction

Building the solar highways would initially create a carbon footprint, as the manufacturing and installation of solar panels are energy-intensive processes. However, the researchers estimate that the system would “pay back” its carbon footprint in about 1.1 years. After that, the environmental benefits would outweigh the costs.

The Biggest Project in History 52 Billion Solar Panels Covering America

Table 2: Challenges of the Solar Highway Project

Challenge Impact
Variations in climate Affects solar panel efficiency
High construction and maintenance costs Potential barrier to implementation
Carbon footprint of construction Offset in 1.1 years

Although the full-scale project is still in the exploratory phase, pilot projects have been conducted in several countries, including the United States, China, Germany, Austria, and Switzerland. These pilot projects have shown promising results, indicating that solar panels can be integrated into highways without disrupting traffic flow or requiring major modifications to the infrastructure.

The data from these pilot projects show that the installation of solar panels on highways can generate significant amounts of electricity. However, there are regional differences in the efficiency of these systems due to varying climatic conditions and solar exposure. This means that while the solar highway project could work well in some areas, it might not be as effective in others.

The solar highway project represents a paradigm shift in the way we think about energy. Rather than relying on fossil fuels, we could harness the power of the sun to fuel our world. This shift is crucial as we move towards a sustainable future.

As we enter the Fifth Industrial Revolution, technology is advancing at an unprecedented rate. Innovations in solar technology have made it possible to generate more energy from smaller installations, making projects like the solar highway more feasible. The efficiency of solar panels has improved dramatically in recent years, and the cost of solar energy is dropping, making it a more viable option for large-scale projects.

Why the World Needs Radical Solutions

The world is facing an environmental crisis. To avert the worst effects of climate change, we need to transition away from fossil fuels and embrace renewable energy sources like solar power. Radical solutions, like the solar highway project, are essential if we are to make this transition in time.

The solar highway project is an example of the kind of out-of-the-box thinking that we need to address the climate crisis. While the project is still in its early stages, it represents a bold vision for the future — one where our highways not only connect cities but also help power them.

#solarenergy, #renewableenergy, #greenfuture, #solarhighways, #carbonemissions, #solartechnology, #fossilfuels, #climatechange, #sustainability, #electricitygeneration, #solarprojects, #globalwarming, #environmentalimpact, #solarpower, #cleanenergy

References:

Global Warming Solutions Everyone Should Know

Summary

  • Global warming is a critical issue that requires urgent action from everyone.
  • Renewable energy sources like solar, wind, and hydropower are key to reducing greenhouse gas emissions.
  • Energy efficiency in homes and businesses can significantly cut carbon footprints.
  • Sustainable transportation options, including electric vehicles and public transit, help reduce emissions.
  • Reforestation and afforestation play vital roles in capturing carbon dioxide from the atmosphere.
  • Reducing waste through recycling, composting, and minimizing single-use plastics can lower emissions.
  • Advocating for policy changes and supporting environmental organizations amplify individual efforts.

Introduction

Global warming, driven by human activities, particularly the burning of fossil fuels, is one of the most pressing challenges of our time. The consequences are far-reaching, affecting everything from weather patterns to sea levels, and posing a threat to ecosystems and human life. However, the good news is that there are solutions within our reach to combat global warming.

Renewable Energy: The Power of the Future

1. Solar Energy

Solar energy harnesses the power of the sun to generate electricity. It’s one of the cleanest and most abundant renewable energy sources available. By installing solar panels on homes and businesses, individuals can significantly reduce their reliance on fossil fuels and lower their carbon footprints.

2. Wind Energy

Wind energy is another crucial renewable resource. Wind turbines convert the kinetic energy of wind into electricity without emitting greenhouse gases. Wind farms, both onshore and offshore, have become increasingly common and play a significant role in reducing global carbon emissions.

3. Hydropower

Hydropower generates electricity by harnessing the energy of flowing water. It’s a well-established and reliable renewable energy source. Dams and other hydropower facilities contribute to a large portion of the world’s renewable energy production, making it a vital component in the fight against global warming.

Energy Efficiency: Doing More with Less

1. Home Energy Efficiency

Improving energy efficiency in homes is one of the most effective ways to reduce greenhouse gas emissions. Simple actions like insulating homes, using energy-efficient appliances, and sealing leaks can significantly lower energy consumption.

2. Business Energy Efficiency

Businesses can also play a vital role in combating global warming by adopting energy-efficient practices. Upgrading to LED lighting, optimizing heating and cooling systems, and implementing energy management systems can lead to substantial energy savings and reduced emissions.

3. Smart Technology

The use of smart technology, such as programmable thermostats and smart meters, allows for better energy management in both homes and businesses. These devices help monitor and control energy usage, leading to more efficient consumption and lower emissions.

Table 1: Key Energy Efficiency Solutions

Solution Description
Home Insulation Reduces the need for heating and cooling by maintaining indoor temperatures.
Energy-Efficient Appliances Lower energy consumption with advanced technology.
LED Lighting Uses less energy and lasts longer than traditional bulbs.
Smart Thermostats Automatically adjusts heating and cooling to save energy.
Business Energy Management Systems that optimize energy use in commercial settings.

Sustainable Transportation: Moving Toward a Greener Future

1. Electric Vehicles (EVs)

Electric vehicles(EVs) are at the forefront of sustainable transportation. Unlike traditional vehicles that run on gasoline or diesel, EVs are powered by electricity, which can be generated from renewable sources. By switching to EVs, individuals can drastically reduce their carbon emissions.

2. Public Transportation

Using public transportation, such as buses, trains, and subways, is another effective way to reduce your carbon footprint. Public transit systems can move large numbers of people with less energy per person compared to individual car use.

3. Biking and Walking

For shorter distances, biking and walking are not only healthy choices but also environmentally friendly. These modes of transportation produce zero emissions and contribute to reduced traffic congestion.

4. Carpooling and Ridesharing

Carpooling and ridesharing are practical ways to reduce the number of vehicles on the road, thus lowering overall emissions. These options are particularly useful in areas where public transportation may not be as accessible.

Reforestation: Restoring the Earth’s Lungs

1. Reforestation Projects

Reforestation involves planting trees in areas where forests have been depleted. Trees act as carbon sinks, absorbing carbon dioxide from the atmosphere and storing it as biomass. Participating in or supporting reforestation projects can have a significant impact on reducing atmospheric CO2 levels.

2. Afforestation

Afforestation refers to planting trees in areas that have not previously been forested. This practice helps to create new carbon sinks and restore ecosystems. It’s an effective way to combat desertification and improve soil quality, which in turn supports agriculture and biodiversity.

3. Urban Greening

Urban greening initiatives, such as planting trees in cities, can also contribute to reducing global warming. Trees in urban areas not only absorb CO2 but also help lower temperatures by providing shade and cooling the air through transpiration.

Reducing Waste: Less is More

1. Recycling

Recycling is a simple yet powerful way to reduce the amount of waste that ends up in landfills, which are significant sources of methane, a potent greenhouse gas. By recycling materials like paper, glass, and metals, we can lower emissions and conserve natural resources.

2. Composting

Composting organic waste, such as food scraps and yard trimmings, reduces methane emissions from landfills and creates nutrient-rich soil for gardening and agriculture. It’s an easy practice that can be done at home or on a community scale.

3. Reducing Single-Use Plastics

Single-use plastics, such as straws, bags, and bottles, contribute to pollution and global warming. By reducing our reliance on these items and choosing reusable alternatives, we can decrease the demand for plastic production, which is energy-intensive and contributes to greenhouse gas emissions.

Table 2: Waste Reduction Strategies

Strategy Description
Recycling Reduces landfill waste and conserves resources by reprocessing materials.
Composting Turns organic waste into valuable compost, reducing methane emissions.
Reducing Single-Use Plastics Lowers demand for plastic production and minimizes pollution.
Reusing and Repurposing Extends the life of products and reduces the need for new resources.
Sustainable Packaging Uses eco-friendly materials to reduce environmental impact.

Policy Advocacy: The Power of Collective Action

1. Supporting Environmental Legislation

Advocating for and supporting environmental policies is crucial in the fight against global warming. This includes legislation that promotes renewable energy, carbon pricing, and emission reduction targets. By voting for leaders who prioritize climate action and participating in public discussions, individuals can help drive policy changes that benefit the planet.

2. Joining Environmental Organizations

Environmental organizations play a vital role in advocating for policies that combat global warming. By joining or supporting these organizations, individuals can amplify their impact and contribute to larger-scale initiatives aimed at protecting the environment.

3. Community Engagement

Community engagement is another powerful tool for driving change. Local initiatives, such as community gardens, recycling programs, and clean energy projects, can have a significant impact when communities come together to tackle global warming.

Education and Awareness: Spreading the Word

1. Educating Yourself

Understanding the causes and consequences of global warming is the first step toward making a difference. By educating yourself about the issue, you can make informed decisions in your daily life that contribute to the solution.

2. Raising Awareness

Raising awareness about global warming within your community is essential for collective action. This can be done through social media, local events, or simply having conversations with friends and family. The more people who understand the importance of addressing global warming, the more likely it is that meaningful change will occur.

3. Incorporating Climate Education in Schools

Incorporating climate education in school curriculums ensures that future generations are equipped with the knowledge and skills needed to tackle global warming. By teaching children about the importance of environmental stewardship, we can foster a culture of sustainability.

Conclusion

Global warming is a complex and urgent issue that requires action on multiple fronts. From adopting renewable energy sources and improving energy efficiency to reducing waste and advocating for policy changes, there are many ways that individuals can contribute to the solution. By understanding and implementing the strategies outlined in this article, everyone can play a role in combating global warming and protecting the planet for future generations.

#GlobalWarming, #ClimateChange, #SustainableLiving, #RenewableEnergy, #EnergyEfficiency, #Reforestation, #WasteReduction, #PolicyAdvocacy, #ClimateEducation, #EcoFriendly

The Mesmerizing Effects of Carbon Dioxide Emissions

Carbon dioxide (CO2) emissions are greatly increasing the planet’s temperature, causing discomfort and, in some areas, making life almost intolerable. NASA’s Scientific Visualization Studio has created visualizations that illustrate how CO2 spreads through the atmosphere, highlighting its worldwide effects. Gaining insight into the sources and consequences of CO2 emissions can help us drive efforts to combat climate change.

Summary

  • CO2 emissions are causing global warming and extreme weather conditions.
  • NASA’s video shows how wind and air currents distribute CO2 around the Earth.
  • Major CO2 sources include power plants, industry, transportation, forest fires, and agricultural burning.
  • Differences in CO2 sources are observed globally: industrial emissions in the USA, South Asia, and China, and burning-related emissions in Africa and South America.
  • The visualization pulses due to daily cycles of forest fires and plant photosynthesis.
  • NASA uses the Goddard Earth Observing System (GEOS) to create high-resolution weather models.
  • The GEOS model is based on data from various satellites and has a resolution over 100 times greater than typical weather models.
  • The effects of CO2 are interconnected and impact everyone globally.
  • Efforts to reduce emissions are crucial for mitigating climate change.

via GIPHY

The Mesmerizing Effects of Carbon Dioxide Emissions

Our CO2 emissions are warming the planet and making life uncomfortable and even unbearable in some regions. In July, the planet set consecutive records for the hottest day. NASA is mapping our emissions, and while what they show us isn’t uplifting, it is visually appealing in a ghoulish way. Maybe the combination of visual appeal and ghoulishness will build momentum in the fight against climate change.

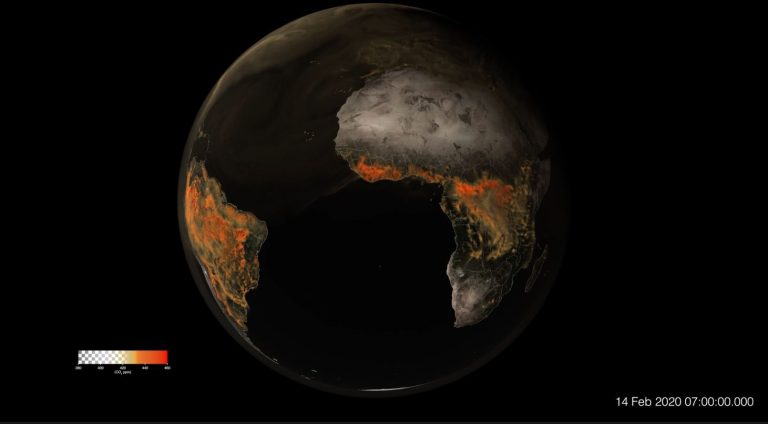
NASA’s Scientific Visualization Studio has released a video showing how wind and air currents pushed CO2 emissions around Earth’s atmosphere from January to March 2020. The video’s high resolution zooms in and sees individual sources of CO2, including power plants and forest fires.

Global CO2 Emission Sources

The video starkly shows that it doesn’t matter where CO2 emissions come from; we all deal with the outcomes. Yet there are some interesting global differences. Above the USA, South Asia, and China, most of the carbon comes from industry, power plants, and transportation. But over Africa and South America, most of the emissions come from burning, including forest fires, agricultural burning, and land clearing. Emissions also come from fossil fuels like oil and coal.

Key Sources of CO2 Emissions:

  • Industry: Factories and industrial processes release large amounts of CO2.
  • Power Plants: Burning fossil fuels for electricity is a major source of emissions.
  • Transportation: Cars, trucks, ships, and airplanes contribute significantly to CO2 levels.
  • Burning: Forest fires, agricultural burning, and land clearing are prominent in Africa and South America.

The Pulsing Effect

The image pulses for a couple of reasons. Forest fires tend to flare during the day and then slow down at night. Also, trees and plants photosynthesize during the day, releasing oxygen and absorbing CO2. The land masses and the oceans act as carbon sinks. There’s more pulsing in South America and the tropics because the data was collected during their growing season.

NASA’s Visualization Technology

In this version, the video zooms in on the USA, showing individual CO2 sources. These visualizations are based on GEOS, the Goddard Earth Observing System. GEOS is an integrated system for modeling Earth’s coupled atmosphere, ocean, and land systems. NASA calls it a “high-resolution weather analysis model,” and it uses supercomputers to show what’s happening in the atmosphere. GEOS is based on billions of data points, including data from the Terra satellite’s MODIS and the Suomi-NPP satellite’s VIIRS instruments. GEOS has a resolution that’s more than 100 times greater than typical weather models.

CO2 Emission Data Analysis

To understand the full impact of CO2 emissions, it’s important to look at the data from various sources. The following tables provide insight into CO2 emissions by sector and by region.

Table 1: CO2 Emissions by Sector (2020)

Sector CO2 Emissions (Million Metric Tons)
Industry 8,600
Power Plants 13,400
Transportation 7,000
Residential 2,000
Agriculture 1,800
Deforestation 3,000

Table 2: CO2 Emissions by Region (2020)

Region CO2 Emissions (Million Metric Tons)
North America 6,800
Europe 4,500
Asia 19,200
Africa 1,800
South America 1,500
Oceania 600

Global Impact and Interconnectedness

“As policymakers and as scientists, we’re trying to account for where carbon comes from and how that impacts the planet,” said climate scientist Lesley Ott at NASA’s Goddard Space Flight Center in Greenbelt, Maryland. “You see here how everything is interconnected by these different weather patterns.”

The visualizations highlight that CO2 emissions have a global impact, regardless of their source. This interconnectedness means that emissions from one region can affect weather patterns and climate conditions worldwide. The global nature of CO2 dispersion underscores the need for international cooperation in addressing climate change.

via GIPHY

The Role of Carbon Sinks

Carbon sinks, such as forests and oceans, play a crucial role in absorbing CO2 from the atmosphere. Trees and plants absorb CO2 during photosynthesis, and the oceans act as a significant reservoir for carbon. However, deforestation and ocean acidification are reducing the effectiveness of these natural carbon sinks. Protecting and restoring forests, as well as addressing ocean health, are essential components of climate action.

Technological Solutions and Innovations

Advancements in technology are providing new ways to monitor and reduce CO2 emissions. NASA’s use of high-resolution weather models and satellite data is one example of how technology can help us understand and address climate change. Other innovations include carbon capture and storage (CCS) technologies, renewable energy sources, and energy-efficient practices.

Key Technological Innovations:

  • Carbon Capture and Storage (CCS): Capturing CO2 emissions from industrial processes and storing them underground.
  • Renewable Energy: Solar, wind, and hydroelectric power reduce reliance on fossil fuels.
  • Energy Efficiency: Improving energy efficiency in buildings, transportation, and industry.

Policy and Global Cooperation

Addressing CO2 emissions requires strong policy measures and global cooperation. International agreements, such as the Paris Agreement, aim to limit global warming by reducing greenhouse gas emissions. Countries must work together to set and achieve emission reduction targets, invest in clean energy, and support developing nations in their climate efforts.

Individual Actions and Community Efforts

Individuals and communities also play a vital role in reducing CO2 emissions. Simple actions, such as reducing energy consumption, using public transportation, and supporting sustainable practices, can make a significant difference. Community efforts, including local renewable energy projects and conservation initiatives, contribute to broader climate goals.

The Urgency of Action

The effects of CO2 emissions are already being felt worldwide, with more frequent and severe weather events, rising sea levels, and impacts on ecosystems and biodiversity. Immediate and sustained action is necessary to mitigate these effects and prevent further damage. By understanding the sources and impacts of CO2 emissions, we can take informed steps toward a more sustainable future.

Conclusion

The mesmerizing effects of carbon dioxide emissions are a stark reminder of the urgent need for climate action. Through technological advancements, global cooperation, and individual efforts, we can address the challenges posed by CO2 emissions and work towards a healthier planet. Understanding the interconnectedness of our actions and their impact on the environment is crucial in building a sustainable future for all.

References

  1. VIIRS (Visible Infrared Imaging Radiometer Suite).  NOAA
  2. Goddard Earth Observing System (GEOS). Wikipedia
  3. About MODIS (Moderate Resolution Imaging Spectroradiometer).  NASA
  4. CO2 Emissions Visualization.  Giphy
  5. CO2 Sources Visualization.  Giphy
  6. New Record Daily Global Average Temperature Reached in July 2024. Copernicus Climate Change Service

Hashtags

#ClimateChange, #CO2Emissions, #GlobalWarming, #NASA, #CarbonDioxide, #EnvironmentalImpact, #ClimateAction, #RenewableEnergy, #CarbonSinks, #SustainableFuture

Impact of Climate Change on Weather

Key Takeaway

Climate change is profoundly altering weather patterns across the globe. This phenomenon is leading to more extreme weather events, changes in precipitation, and rising temperatures, which in turn have significant impacts on ecosystems, human health, and economies. Understanding these changes is crucial for developing strategies to mitigate and adapt to the evolving climate.

Summary

  • Global Warming: Rising temperatures due to increased greenhouse gases.
  • Extreme Weather Events: More frequent and severe storms, heatwaves, and droughts.
  • Changing Precipitation Patterns: Altered rainfall, leading to floods and water scarcity.
  • Impact on Ecosystems: Shifts in habitats and species distributions.
  • Human Health Risks: Increased heat-related illnesses and spread of diseases.
  • Economic Consequences: Damage to infrastructure, agriculture, and increased disaster management costs.
  • Adaptation and Mitigation: Strategies to reduce greenhouse gas emissions and enhance resilience to climate impacts.
  • Policy and Global Efforts: International agreements and policies aimed at combating climate change.

Introduction

Climate change, driven primarily by human activities, is causing significant and potentially irreversible changes to our planet’s weather patterns. These changes are not just about warmer temperatures; they encompass a broad range of climatic shifts that affect every aspect of life on Earth. This article delves into how climate change is impacting weather, exploring the science behind these changes, their consequences, and what can be done to mitigate and adapt to these effects.

Global Warming

Rising Temperatures

One of the most direct impacts of climate change is global warming. The Earth’s average temperature has increased by approximately 1.2°C (2.2°F) since the late 19th century, largely due to the burning of fossil fuels which releases carbon dioxide (CO2) and other greenhouse gases into the atmosphere.

Heatwaves

As global temperatures rise, heatwaves are becoming more frequent and severe. These prolonged periods of excessive heat pose significant risks to health, agriculture, and energy systems.

According to the World Meteorological Organization, heatwaves have increased in frequency, intensity, and duration over the past few decades due to climate change.”

Extreme Weather Events

Storms and Hurricanes

Climate change is increasing the intensity of storms and hurricanes. Warmer ocean temperatures provide more energy for tropical storms, making them stronger and more destructive.

Droughts and Floods

Changes in precipitation patterns are leading to more extreme droughts and floods. Some regions are experiencing prolonged dry spells, while others are seeing increased rainfall, leading to severe flooding.

Wildfires

Higher temperatures and prolonged droughts create ideal conditions for wildfires. These fires have devastating effects on ecosystems, property, and human life.

Changing Precipitation Patterns

Altered Rainfall

Climate change is causing shifts in precipitation patterns, with some areas receiving more rainfall and others experiencing significant reductions. This variability can lead to both water scarcity and flooding, affecting agriculture and water supply.

Snow and Ice

Warmer temperatures are leading to reduced snowpack and earlier melting of snow and ice. This affects freshwater availability and contributes to sea-level rise.

Impact on Ecosystems

Shifts in Habitats

As temperatures rise and precipitation patterns change, many species are forced to migrate to new areas. This can disrupt existing ecosystems and lead to loss of biodiversity.

Ocean Acidification

Increased CO2 levels are not only warming the planet but also making the oceans more acidic. This has severe consequences for marine life, particularly coral reefs and shellfish.

Human Health Risks

Heat-Related Illnesses

Rising temperatures increase the risk of heat-related illnesses, such as heat stroke and dehydration. Vulnerable populations, including the elderly and those with pre-existing health conditions, are particularly at risk.

Spread of Diseases

Climate change is affecting the distribution of diseases. Warmer temperatures and altered rainfall patterns can expand the range of vector-borne diseases, such as malaria and dengue fever.

Economic Consequences

Damage to Infrastructure

Extreme weather events, such as hurricanes and floods, cause significant damage to infrastructure, leading to costly repairs and reconstruction efforts.

Agricultural Impacts

Changes in weather patterns affect crop yields and livestock, threatening food security. Prolonged droughts and extreme heat can devastate agricultural production.

Increased Disaster Management Costs

Governments and organizations are facing rising costs associated with disaster management and recovery efforts. This includes not only immediate response but also long-term rebuilding and adaptation measures.

Baltic sea after the storm. Soft sunset light, dramatic glowing clouds. Seascape, cloudscape, nature. Panoramic view. Ecology, climate change, weather

Adaptation and Reduction

Reducing Greenhouse Gas Emissions

Mitigating climate change involves reducing greenhouse gas emissions through cleaner energy sources, improved energy efficiency, and sustainable practices.

Enhancing Resilience

Adaptation strategies include building resilient infrastructure, improving water management, and developing early warning systems for extreme weather events.

Community-Based Approaches

Engaging local communities in adaptation efforts ensures that measures are tailored to specific needs and contexts, enhancing their effectiveness.

Policy and Global Efforts

International Agreements

Agreements like the Paris Agreement aim to unite countries in the fight against climate change by setting targets for reducing greenhouse gas emissions.

National Policies

Countries are implementing various policies to address climate change, such as carbon pricing, renewable energy incentives, and regulations to reduce emissions.

Corporate Responsibility

Businesses are increasingly recognizing their role in combating climate change. Many are adopting sustainable practices and setting emissions reduction targets.

Climate change is reshaping our world in profound ways, particularly through its impact on weather patterns. Understanding these changes and their implications is crucial for developing effective strategies to mitigate and adapt to climate change. By taking collective action at the global, national, and local levels, we can work towards a more sustainable and resilient future.

References

  1. World Meteorological Organization. (2023). “State of the Global Climate 2022.” link.
  2. Intergovernmental Panel on Climate Change. (2021). “Climate Change 2021: The Physical Science Basis.” link.
  3. National Aeronautics and Space Administration. (2023). “Global Climate Change: Vital Signs of the Planet.” link.

Hashtags

#ClimateChange, #GlobalWarming, #ExtremeWeather, #EnvironmentalImpact, #Sustainability, #ClimateAction, #Resilience, #Adaptation, #Mitigation, #GreenhouseGases

Antarctic 2024: Another Giant Antarctic Iceberg Breaks Free

Key Takeaway

The recent calving of a giant iceberg (A-83) from the Brunt Ice Shelf in Antarctica is another sign of the weakening ice shelves due to rising global temperatures.

Summary

  • A large iceberg measuring 380 square kilometers (147 square miles) named A-83 broke away from the Brunt Ice Shelf in Antarctica on May 20th, 2024.
  • This is the third major calving event in Antarctica in the last four years, following A-74 in 2021 and A-81 in 2023.
  • Satellites like ESA’s Copernicus Sentinel-1 and NASA’s Landsat 8 captured the calving event using radar imaging and thermal data.
  • The calving is attributed to the weakening of ice caused by the McDonald Ice Rumples and the extension of the ‘Halloween Crack’ in the Brunt Ice Shelf.
  • Scientists use satellite data to monitor ice shelf health in response to climate change.
  • The iceberg doesn’t pose a threat to the Halley VI Research Station, which was relocated earlier due to ice shelf instability.
  • The ongoing ice loss in Antarctica is a worrying sign of global warming, leading to sea-level rise, coastal flooding, and further temperature increase.
  • Monitoring polar ice plays a crucial role in climate change adaptation and reduction strategies.
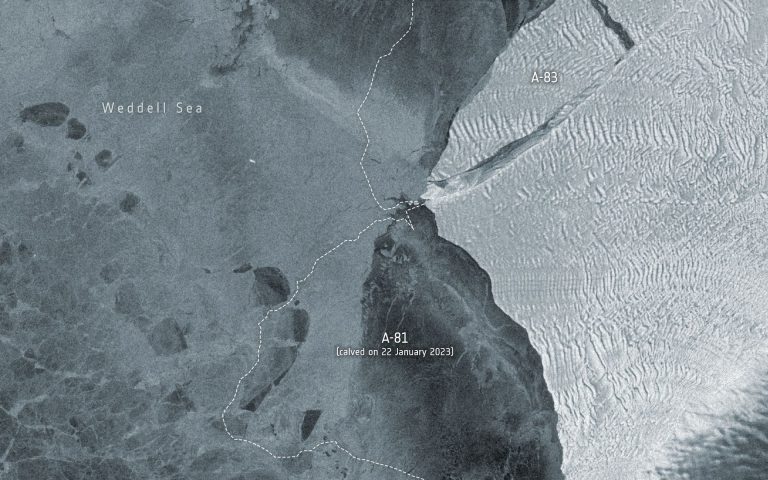
Data on brightness temperature is from the U.S. Landsat 8 mission. Credit: ESA/USGS

Another Antarctic Iceberg Breaks Away

The icy expanse of Antarctica is constantly changing, but a recent event has scientists raising a collective eyebrow. On May 20th, 2024, a massive iceberg measuring a staggering 380 square kilometers (147 square miles) broke away from the Brunt Ice Shelf. This behemoth, named A-83, marks the third significant calving event in Antarctica in just four years, following A-74 in 2021 and the even larger A-81 in 2023.

These repeated calving events are a stark reminder of the accelerating impact of climate change on the Earth’s polar regions. The Brunt Ice Shelf is a critical buttress for glaciers flowing into the Weddell Sea. As the ice shelf weakens, these glaciers lose support and accelerate their flow into the ocean, contributing to rising sea levels.

The culprit behind the recent calving is a combination of factors. The McDonald Ice Rumples, underwater ridges that disrupt the flow of ice, have weakened the Brunt Ice Shelf for some time. Additionally, a vast crack, ominously nicknamed the “Halloween Crack,” has steadily grown within the ice shelf, further compromising its structural integrity.

Thankfully, sophisticated Earth observation satellites are keeping a watchful eye on Antarctica. ESA’s Copernicus Sentinel-1 and NASA’s Landsat 8 played a vital role in capturing the calving event. Sentinel-1, with its radar imaging capabilities, can see through clouds and darkness, providing valuable data year-round. Landsat 8, on the other hand, uses thermal imaging to help scientists assess ice sheet thickness. By analyzing these different datasets, scientists can monitor changes in ice shelves and understand the mechanisms driving calving events.

The good news is that the A-83 iceberg doesn’t pose an immediate threat to the British Antarctic Survey’s Halley VI Research Station. The station was strategically relocated in 2017 due to concerns about ice shelf stability. However, the bigger picture remains a cause for concern. The ongoing loss of ice from Antarctica is a significant contributor to rising sea levels. This, in turn, threatens coastal communities around the world with increased flooding and erosion.

Furthermore, as polar ice sheets melt, they expose darker ocean surfaces that absorb more solar radiation. This creates a vicious cycle, accelerating global warming even further.

The recent calving event in Antarctica underscores the urgency of addressing climate change. Continued monitoring of the polar ice caps through advanced satellite technology is crucial for understanding the pace and impact of ice loss. This data is essential for developing effective mitigation strategies and adaptation plans to tackle the challenges posed by a warming planet.

This isn’t just a story about a giant iceberg breaking free. It’s a story about the interconnectedness of our planet and the far-reaching consequences of climate change. By understanding the science behind these events, we can take informed action to ensure a sustainable future for ourselves and generations to come.

HASHTAGS:

#Antarctica, #Icebergs, #ClimateChange, #GlobalWarming, #Glaciology, #EarthScience, #SeaLevelRise, #RemoteSensing, #PolarIce, #Environment, #antarctic 2024

References

  1. IPCC Sixth Assessment Report – Intergovernmental Panel on Climate Change (IPCC)
  2. Iceberg A-83 Breaks Free – European Space Agency (ESA)

Sea Level Rise: The Looming Crisis

Key Takeaways

Sea level rise is a consequence of climate change, driven by the melting of glaciers and polar ice sheets, and the thermal expansion of seawater. The global average sea level is projected to rise by nearly 1 foot by 2050 and potentially more than 3 feet by 2100. Coastal areas, particularly those in the United States, are already experiencing increased flooding, saltwater intrusion, and economic impacts due to rising seas. Strategies to adapt to sea level rise include building sea walls, elevating infrastructure, and implementing nature-based solutions. Policy solutions such as managed retreat, climate adaptation funding, and international cooperation are essential to mitigate and adapt to rising sea levels.

Summary

  • Global causes: Melting ice sheets, thermal expansion of seawater.
  • Local causes: Groundwater pumping, tectonic shifts, local geology.
  • Effects: Extreme weather, tidal flooding, land loss, economic impacts, saltwater intrusion, climate migration.
  • Responses: Property protection, infrastructure adaptations, nature-based solutions, policy interventions.
  • Future projections: 1 foot rise by 2050, over 3 feet by 2100, with higher scenarios predicting up to 6.6 feet by the end of the century.
  • Challenges: Economic costs, displacement of communities, contamination of freshwater resources.

What is Sea Level Rise?

Sea level rise refers to the increase in the total volume of ocean water, resulting primarily from the melting of glaciers and polar ice sheets and the thermal expansion of seawater as it warms. These changes are driven by climate change, which is caused by the burning of fossil fuels.

Types of Sea Level Rise

  1. Global Mean Sea Level Rise: This is the global average sea level change relative to a fixed point, such as the center of the Earth. It reflects the overall increase in the volume of the ocean and is most directly linked to climate change.
  2. Relative Sea Level Change: This measures the height of the ocean’s surface relative to a specific piece of land. It can be influenced by both rising water levels and changes in land elevation.

In 2022, U.S. agencies like NOAA projected several scenarios for future sea level rise, depending on greenhouse gas emissions. These scenarios predict a global mean sea level rise of almost 1 foot by 2050 and more than 3 feet by 2100 under intermediate scenarios. In high-emission scenarios, sea levels could rise by up to 6.6 feet by the end of the century.

Table 1: Projected Global Sea Level Rise Scenarios

Scenario 2050 Projection (Feet) 2100 Projection (Feet)
Low 0.6 – 1.2 1.6 – 3.3
Intermediate 0.9 – 1.8 2.3 – 4.9
High 1.2 – 2.0 3.3 – 6.6

Global Causes of Sea Level Rise

Melting Ice

Melting ice from glaciers and polar ice sheets is a significant contributor to sea level rise. For instance, the Greenland ice sheet loses about 270 billion tons of ice each year.

Thermal Expansion

As the oceans absorb heat from greenhouse gases, the water expands. This process, known as thermal expansion, has contributed to one-third of the global sea level rise since 2004.

Local Causes of Sea Level Rise

Local Geology

In some areas, geological factors cause land to sink, making the sea appear to rise faster. Norfolk, Virginia, is one such example, built on a slowly sinking impact crater.

Tectonic Shifts

Tectonic movements can also affect local sea levels. For example, parts of California are being pushed upward, masking the effects of sea level rise.

Groundwater Pumping

Extracting groundwater can cause land to settle, leading to a relative rise in sea levels. Jakarta, Indonesia, is sinking rapidly due to excessive groundwater pumping.

Effects of Sea Level Rise

Rising sea levels amplify the effects of extreme weather events. Higher baseline water levels mean that storm surges and flooding will be more severe.

Tidal Flooding

Coastal areas are experiencing more frequent high tide floods, known as “nuisance” or “sunny day” floods. NOAA projects that by 2050, the U.S. will see an average of 45 to 85 high tide flooding days per year.

Land Loss and Coastal Erosion

Rising seas will permanently submerge some areas of land and accelerate coastal erosion. By 2050, 4.4 million acres of U.S. properties could be below tide lines.

Economic Impacts

Sea level rise threatens costly infrastructure like sewage plants and power stations. The economic losses could reach trillions of dollars by 2100, with annual costs of $14 trillion from adaptation efforts alone.

Table 2: Economic Impacts of Sea Level Rise

Impact Annual Cost (By 2100)
Property Loss $500 million
Infrastructure Damage $14 trillion
Energy Facilities Nearly 300 at risk
Transportation 2,400 miles of roadway

Saltwater Intrusion and Freshwater Contamination

Saltwater intrusion from rising seas threatens freshwater sources and agricultural lands, particularly in coastal areas like Miami and Bangladesh. This contamination can lead to water insecurity and displacement.

Climate Migration

Rising sea levels will force populations to relocate, creating potential refugee crises. Up to 13 million people in the U.S. and millions more globally could be displaced by permanent inundation.

Concept image of a flooded Basilica San Giorgio Maggiore in Venice as sea level rise makes the city uninhabitable

Responses and Adaptations to Rising Sea Levels

Strategies for Property Owners

  • Flood Risk Assessment: Use flood maps to understand your risk.
  • Flood Insurance: Purchase insurance to protect against potential losses.
  • Home Elevation: Elevate homes and important possessions to avoid flood damage.
  • Relocation: Consider moving to safer, higher ground.

Strategies for Infrastructure

  • Sea Walls: Construct barriers to protect against flooding and storm surges.
  • Elevated Roads: Raise roads to prevent flooding.
  • Water Pumps: Install pumps to remove collected water.

Nature-Based Strategies

Preserving and restoring natural defenses like wetlands, dunes, and mangroves can reduce flood risks and provide additional benefits like recreation and food sources.

Policy Solutions

Engage at-risk communities in long-term planning to relocate infrastructure and homes to safer areas while bolstering resilience where necessary. Increase state and federal funding for climate adaptation projects, reform flood insurance programs, and protect critical infrastructure. International cooperation is essential. Major polluters must fulfill their commitments to reduce emissions, invest in clean energy, and support vulnerable nations through initiatives like the Green Climate Fund.

Conclusion

Sea level rise presents a significant challenge that requires immediate and sustained action. From understanding the science behind it to implementing practical and policy solutions, every effort counts. As the impacts of rising seas become more evident, it is crucial for governments, communities, and individuals to work together to mitigate risks and adapt to the changing climate.

Hashtags

#ClimateChange, #SeaLevelRise, #GlobalWarming, #CoastalFlooding, #EnvironmentalImpact, #ClimateAction, #SustainableLiving, #AdaptationStrategies

PREFIRE Mission by NASA Set to Explore Earth’s Poles

Key Takeaway

NASA’s PREFIRE mission is set to enhance our understanding of heat emissions from Earth’s poles using a pair of cubesats designed to measure far-infrared radiation. This data will provide critical insights into the rapidly changing polar climates and their global impacts.

Summary

  • Mission Name: Polar Radiant Energy in the Far-Infrared Experiment (PREFIRE)
  • Objective: Measure heat emissions from Earth’s polar regions
  • Satellites: Two cubesats, “Ready, Aim, PREFIRE” and “PREFIRE and ICE”
  • Launch Dates: May 22 (Ready, Aim, PREFIRE), a few days later (PREFIRE and ICE)
  • Launch Site: Rocket Lab’s Launch Complex 1, Māhia, New Zealand
  • Primary Instrument: Thermal infrared spectrometers
  • Key Measurements: Far-infrared radiation (wavelengths > 15 microns)
  • Significance: Data to improve climate models, predict sea level rise, and understand polar climate impacts
  • Accessibility: Open and freely available data for global scientists
  • Partners: University of Wisconsin-Madison, NASA’s Jet Propulsion Laboratory
  • Similar Missions: Mars Climate Sounder (MCS), Diviner Lunar Radiometer Experiment

The PREFIRE Mission

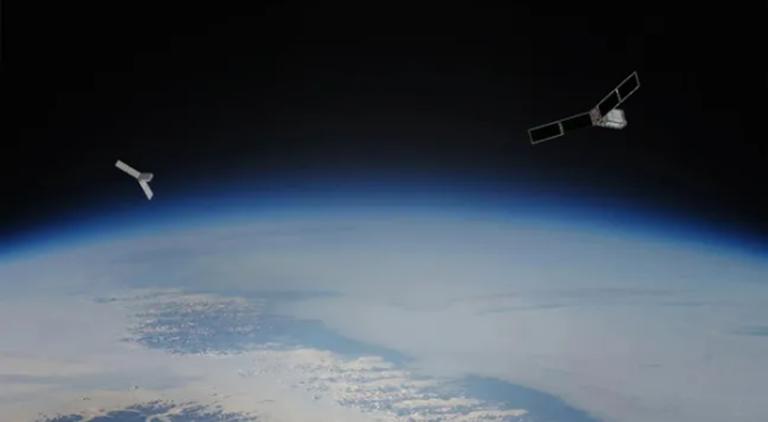
Heat emissions from Earth’s polar regions are a critical component of our planet’s climate system. However, we know surprisingly little about how this heat is lost to space. NASA’s Polar Radiant Energy in the Far-Infrared Experiment (PREFIRE) aims to change that. This mission, involving two small cubesats, will provide unprecedented data on the far-infrared radiation emitted from the Arctic and Antarctic, offering new insights into the polar climate and its broader impacts on global weather systems.

Mission Overview

The Satellites

PREFIRE consists of two cubesats, rightly named “Ready, Aim, PREFIRE” and “PREFIRE and ICE.” These compact satellites, each about the size of a loaf of bread, will launch separately into near-polar orbits. The first cubesat is scheduled to launch on May 22, 2024, aboard a Rocket Lab Electron rocket from Māhia, New Zealand. The second will follow a few days later.

Scientific Goals

The primary goal of PREFIRE is to measure far-infrared radiation, specifically wavelengths longer than 15 microns. This spectrum accounts for approximately 60% of the total heat lost at the poles. “We’ve never measured that before,” said Tristan L’Ecuyer, PREFIRE’s Principal Investigator at the University of Wisconsin-Madison, emphasizing the mission’s groundbreaking nature.

The Importance of Polar Heat Emissions

Rapid Arctic Warming

The Arctic is experiencing warming at a rate faster than any other region on Earth, leading to significant changes in local ecosystems and global weather patterns. Understanding how heat is emitted from this region is crucial for predicting future climate changes. “Ultimately, [PREFIRE] information is going to be combined with our climate models,” L’Ecuyer explained, “and hopefully we’ll be able to improve our ability to simulate what sea level rise might look like in the future.”

Global Climate Impacts

The data collected by PREFIRE will be invaluable in refining our climate models, particularly in understanding how polar changes affect weather systems worldwide. This includes better predictions of phenomena such as sea level rise and extreme weather events.

Technical Specifications

Instruments and Design

Each PREFIRE cubesat is equipped with a single thermal infrared spectrometer. These instruments are scaled-down versions of technology used in previous NASA missions, such as the Moon Mineralogy Mapper (M3) and the Mars Climate Sounder (MCS). Mary White, PREFIRE Project Manager at NASA’s Jet Propulsion Laboratory, noted, “We’ve adapted proven technology for a cost-effective, focused mission.”

Dual-Satellite Approach

Having two satellites provides a unique advantage. “Having one cubesat would be able to sort of map out what the emission looks like in the polar regions,” said L’Ecuyer. “We’ll be using the two cubesats to make measurements over the course of several hours, taking the difference between those measurements and trying to understand how the processes that are occurring in the Arctic are actually affecting the emission from the Arctic.”

Broader Context and Collaboration

Part of a Larger Effort

PREFIRE fits into NASA’s broader strategy of combining large-scale missions with smaller, specialized ones to create a comprehensive understanding of Earth’s climate system. Karen St. Germain, NASA’s Earth Science Division director, explained, “NASA needs both our large missions and these smaller missions… to answer this full range of questions we have about understanding the Earth as a system.”

Data Accessibility

In line with NASA’s commitment to open science, all data collected by PREFIRE will be freely available to the public. This ensures that researchers worldwide can access and utilize this valuable information to further our collective understanding of climate dynamics. “All NASA data are open and freely available to all scientists or all people who are interested around the world,” White confirmed.

Expected Outcomes

Enhanced Climate Models

The insights gained from PREFIRE will significantly enhance our climate models. By providing detailed measurements of far-infrared radiation, scientists can better understand the heat exchange processes at the poles and their influence on global climate systems. This will improve predictions of future climate scenarios, including the rate and impact of sea level rise.

Informed Policy Decisions

The data from PREFIRE will not only advance scientific knowledge but also inform policy decisions related to climate change mitigation and adaptation. Accurate climate models are essential for developing effective strategies to address the ongoing and future impacts of global warming.

Tables

Table 1: Key Details of PREFIRE Mission

Component Details
Mission Name Polar Radiant Energy in the Far-Infrared Experiment (PREFIRE)
Objective Measure heat emissions from Earth’s polar regions
Satellites Two cubesats: “Ready, Aim, PREFIRE” and “PREFIRE and ICE”
Launch Dates May 22, 2024 (Ready, Aim, PREFIRE), a few days later (PREFIRE and ICE)
Launch Site Rocket Lab’s Launch Complex 1, Māhia, New Zealand
Primary Instrument Thermal infrared spectrometers
Measurement Focus Far-infrared radiation (wavelengths > 15 microns)
Data Accessibility Open and freely available to the public
Partners University of Wisconsin-Madison, NASA’s Jet Propulsion Laboratory

Table 2: Similar NASA Missions and Technologies

Mission Objective Key Instrument Outcome
Mars Climate Sounder (MCS) Study Martian atmosphere and climate Thermal infrared spectrometer Improved understanding of Martian climate processes
Diviner Lunar Radiometer Experiment Measure lunar surface temperatures Radiometer Detailed thermal maps of the Moon’s surface
Moon Mineralogy Mapper (M3) Map mineral composition of the Moon Imaging spectrometer Discovery of water/hydroxyl on the lunar surface

NASA’s PREFIRE mission represents a significant step forward in our understanding of the polar climate and its global impacts. By measuring far-infrared radiation from the Arctic and Antarctic, PREFIRE will provide critical data to improve climate models, predict sea level rise, and understand the broader effects of polar climate change. The mission’s open data policy ensures that scientists worldwide can access and utilize this information, fostering global collaboration in the fight against climate change.

With PREFIRE, NASA continues to lead the way in climate research, combining cutting-edge technology with a commitment to open science and international cooperation. As the mission unfolds, the data collected will be invaluable in our efforts to understand and mitigate the impacts of a warming world.

Hashtags

#NASA, #PREFIRE, #ClimateChange, #EarthScience, #PolarResearch, #FarInfrared, #Cubesats, #ArcticWarming, #GlobalWarming, #ClimateModels, #SpaceResearch, #NASAClimate, #OpenScience

How Small Aerosols Shape Cloud Formation

Key Takeaway

The study reveals that aerosols as small as 25-30 nanometers, much smaller than previously thought, can initiate cloud formation, which challenges current climate models and suggests the need for recalibration to account for the influence of these tiny aerosols on cloud formation and climate predictions.

Summary

  • A recent collaborative study utilizing global satellite data and direct observations off the California coast shows that aerosol particles as small as 25-30 nanometers are crucial for cloud development, contrary to the established norm of 60 nanometers.
  • Clouds are essential components of Earth’s climate system, but they also constitute one of the largest uncertainties in understanding climate change.
  • The study focused on the behavior of cloud condensation nuclei within marine stratus clouds and found that the size threshold required for these nuclei to trigger cloud formation is much smaller than previously believed.
  • Traditionally, it was thought that cloud condensation nuclei had to be relatively large, but the researchers discovered that even smaller proto-seeds can serve as effective nuclei.
  • The sensitivity of cloud formation to these smaller aerosols arises because they can be activated into cloud droplets in conditions where water is highly supersaturated.
  • The combined observations from marine stratus clouds and global data from the MODIS satellite instrument revealed a consistent pattern of higher-than-expected supersaturation across the globe, adjusting the scale of critical seed size downwards.
  • The discovery that smaller aerosols can effectively contribute to cloud formation suggests that climate models need to be recalibrated to account for these dynamics, potentially improving predictions of future climate scenarios.
  • The study not only challenges established paradigms in climatology but also opens the door for further investigations into the delicate interplays at the heart of our planet’s climate system.

Tiny Aerosols: The Unexpected Key Players in Cloud Formation

Cloud formation is a complicated process that has always interested scientists and climatologists. Clouds are crucial to our atmosphere. They help regulate Earth’s climate by reflecting sunlight and interacting with thermal radiation. A recent groundbreaking study has challenged our understanding of how clouds form.

Traditionally, it was believed that cloud condensation nuclei – the seed particles around which water condenses to form clouds – had to be relatively large, typically around 60 nanometers or larger. This belief was deeply ingrained in climate models and our understanding of atmospheric processes.

However, a collaborative research effort involving scientists from The Technical University of Denmark, the University of Copenhagen, and the Hebrew University of Jerusalem has uncovered a surprising truth that could redefine our approach to climate modeling.

Through a combination of global satellite data and direct observations off the California coast, the researchers made a remarkable discovery: aerosol particles as small as 25-30 nanometers can initiate cloud formation. This finding challenges the long-held assumption that larger particles are necessary for this process.

The study focused specifically on the behavior of cloud condensation nuclei within marine stratus clouds, which are prevalent over vast swaths of the Earth’s oceans. The researchers found that the size threshold required for these nuclei to trigger cloud formation is much smaller than previously believed.

The sensitivity of cloud formation to these smaller aerosols arises from a fundamental principle: the denser the water vapor, the smaller the necessary seed particle. In other words, in conditions where water is highly supersaturated, even minuscule aerosol particles can catalyze the formation of cloud droplets.

This revelation deeply affects our understanding of climate dynamics. It also impacts the accuracy of climate models.

The study’s findings suggest that current climate models may be underestimating the influence of smaller aerosols on cloud formation, particularly in pristine areas where marine stratus clouds dominate. As a result, these models may need to be recalibrated to account for the dynamics of these tiny particles.

Henrik Svensmark, the lead author of the study, emphasized the significance of this discovery:

“Current models show that due to the growth time, most of the small aerosols are lost before they grow to the critical size, and thus, cloud formation is rather insensitive to changes in the production of small aerosols. Our results change this understanding as aerosols must grow much less, which is important for modeling clouds and climate predictions.”

This study challenges existing ideas in climatology and encourages more research into our planet’s climate system. It focuses on the complex interactions involving aerosols, water vapor, and clouds. Exploring this balance is crucial because it deeply affects our understanding of climate change and its consequences.

HASHTAGS:

#climatechange, #cloudformation, #aerosols, #climatemodeling, #atmosphericscience, #environmentalresearch, #sustainability, #climateaction, #scientificdiscovery, #globalwarming

Source: Geophysical Research Letters

Pin It
error: Content is protected !!

On this website we use first or third-party tools that store small files (<i>cookie</i>) on your device. Cookies are normally used to allow the site to run properly (<i>technical cookies</i>), to generate navigation usage reports (<i>statistics cookies</i>) and to suitable advertise our services/products (<i>profiling cookies</i>). We can directly use technical cookies, but <u>you have the right to choose whether or not to enable statistical and profiling cookies</u>. <b>Enabling these cookies, you help us to offer you a better experience</b>.