Tag

#FutureMissions

Browsing

NASA Countdown Begins: Most Powerful Human Spaceflight Ever

NASA is gearing up for the most powerful human spaceflight ever with the Artemis II mission, utilizing the Space Launch System (SLS) rocket. This mission marks a significant milestone in space exploration, setting the stage for future lunar missions and ultimately, Mars exploration.

Summary

  • The Space Launch System (SLS) rocket is being prepared for the Artemis II mission, scheduled for no earlier than September 2025.
  • The SLS rocket’s core stage, equipped with four RS-25 engines, was moved to the Vehicle Assembly Building (VAB) on July 24.
  • The RS-25 engines, converted from the Space Shuttle Program, include engines with previous spaceflight experience.
  • The SLS rocket, with its core stage and solid rocket boosters, provides 8.8 million pounds of thrust at liftoff.
  • NASA astronauts Reid Wiseman, Victor Glover, and Christina Koch, along with Canadian astronaut Jeremy Hansen, will fly in the Orion capsule for a 10-day mission around the moon.
  • Artemis II aims to validate the life-support systems of the Orion capsule in preparation for Artemis III, which plans to return humans to the lunar surface in 2026.
  • The mission will mark significant milestones: Glover as the first Black man, Koch as the first woman, and Hansen as the first Canadian to travel beyond low-Earth orbit.
  • Delays in the Artemis program are primarily due to issues with the Orion capsule’s heat shield and other technical challenges.
  • The Artemis program is a major part of NASA’s budget, with the Artemis III mission projected to cost $93 billion since 2012.
  • Future SLS launches face cost challenges, but competition from SpaceX and Blue Origin may offer more affordable options.
  • NASA aims to land humans on Mars by 2040 as part of the long-term Artemis program goals.
NASA Countdown Begins Most Powerful Human Spaceflight Ever
An illustration of a nice deep space planet background

Main Article

The launch clock isn’t set yet, but the hardware is lined up for what would become the most powerful rocket to ever send humans into space during a moonbound trip the likes of which has not happened in more than 50 years. The biggest piece of the Space Launch System rocket, the 212-foot-long core stage, crept its way into the massive Vehicle Assembly Building on July 24, where work will begin to prepare it for the Artemis II launch set for no earlier than September 2025.

“The clock’s already started,” said John Honeycutt, NASA SLS program manager. “We’ve got a great deal of work to do to get the rocket ready to go fly.”

The core stage sports four RS-25 engines converted by Melbourne-based L3Harris’ Aerojet Rocketdyne from the retired stock of the Space Shuttle Program. Two of the engines have previously flown on a combined 20 shuttle missions, while the other pair are making their debuts. Engine 2047 flew on STS-135, the final launch of the program on Space Shuttle Atlantis in 2011.

Also no stranger to KSC are the casings from the two solid rocket boosters fabricated by Northrop Grumman. They had previously supported space shuttle missions but were regularly fished out of the ocean for refurbishment. Those two boosters sit broken down into five segments each just north of the VAB at the Rotation, Processing, and Surge Facility.

Combined, the core stage and the boosters provide 8.8 million pounds of thrust on liftoff. Their next launch will make the SLS the most powerful rocket to ever send humans into space. NASA astronauts Reid Wiseman, Victor Glover, and Christina Koch with Canadian astronaut Jeremy Hansen will ride in the Lockheed Martin-built Orion capsule for what’s planned to be a 10-day trip around the moon.

Doug Hurley, a former NASA astronaut and now an executive with Northrop Grumman who flew on both shuttle missions and the first human spaceflight of SpaceX Crew Dragon, has tried to give the astronauts an idea of what their ride might be like.

“The ride on the booster for 126 seconds, I just said it’s gonna be the most incredible ride of your life. Because really, the acceleration is eye-watering,” Hurley said.

The shuttle rides used boosters made up of four segments versus the five that are stacked for SLS, and with Orion on top of the core stage, it will be more like the Apollo astronauts’ rides on the Saturn V rocket.

“Being on the top of the stack and feeling the steering … can’t wait to hear the story,” he said.

Their goal is to ensure the Orion capsule’s life-support systems work, setting up the Artemis III mission no earlier than September 2026. That mission aims to return humans, including the first woman, to the lunar surface for the first time since the Apollo 17 mission in 1972.

The Artemis II quartet, though, will still travel more than 230,000 miles from Earth, and while not landing on the moon, flying beyond low-Earth orbit is a feat that also has not been accomplished by humans since the final Apollo flight. Glover will become the first Black man to make the trip, Koch the first woman, and Hansen the first Canadian. All 24 of the astronauts who made the trip during nine Apollo missions to the moon between 1968 and 1972 were white American men. Six of those missions sent 12 of those men to the lunar surface.

Delays and Uncertainty

The 2025 launch date for Artemis’ first human spaceflight is nearly a year behind the schedule laid out after the successful launch of Artemis I in November 2022. A roughly two-year gap between the uncrewed debut and the first crewed mission was thought to be enough time to pore over the Artemis I data and work through any issues. But a series of major bumps in the road became evident and one of them has yet to have a final solution revealed by NASA.

That’s the fact that the protective coating on Orion’s heat shield lost a lot more material, some in fist-sized chunks, than what was expected. The ultimate solution for the Orion capsule will be the major domino holding up the process of stacking the SLS to get ready for launch. Managers won’t begin putting it together vertically until they know there will be a spacecraft coming to top it off, but even though this is the second time around, NASA managers expect to face some hurdles.

“There’s always something that happens, you know, something spills on something, some test didn’t work as planned,” said Chris Cianciola, the SLS deputy program manager. “So you triage it all the way. You don’t want to wait ’til you get out to the launch pad to find out you got a problem.”

For now, a completed Orion capsule is expected to be delivered to the VAB by Oct. 31. If NASA signals no delay, then the first placement of the solid rocket boosters in the VAB could begin in September. NASA has built in a one-year lifespan limiter for the solid rocket boosters, a clock that starts ticking the moment the second segment is placed atop the first. That’s expected to happen in the late fall, which would keep Artemis II on its launch target timeline.

Another limiting factor in stacking is getting back to the VAB the mobile launcher on which SLS and Orion will sit. Currently parked at KSC’s Launch Pad 39-B, it has had to go through a series of repairs after the Artemis I launch tore parts of it to shreds.

“These are the largest solid rocket motors on the planet, and when that vehicle lifts off from the mobile launcher, that plume has to go someplace,” said Shawn Quinn, program manager for Exploration Ground Systems (EGS) based at KSC. “As the vehicle gets higher up, that plume spreads out, and it’s a very, very strong force. … Forget about the heat for a moment, but if the person was standing there, they’d be blown out to kingdom come.”

EGS crews also have had to install emergency exit apparatus such as the zipline cages and crew access arm changes so the humans on board can have a chance to survive if something goes wrong on the pad. Quinn said that work is “nearly done” and the mobile launcher should be back at the VAB in time for stacking.

Cost and Criticism

The Artemis program now controls the majority of NASA’s annual budget this year, surpassing the overall science mission budget for the first time as the agency’s top-funded segment. The enacted fiscal 2024 budget comes out to more than $7.6 billion of NASA’s overall $24.875 billion budget. Because the Artemis program involves so many commercial partners, it has a lot of support across Congress, which ultimately approves the budget. So while the science budget request was cut by more than $500 million from the Biden administration request this fiscal year, the Artemis campaign programs were nearly fully funded.

NASA’s Office of the Inspector General has continued to audit the growing costs of the Artemis program, with a 2023 report stating that the Artemis III missions will cost the country $93 billion since its inception in 2012. That’s billions more than envisioned with delays and cost increases plaguing the leadup to Artemis I. The SLS rocket represents 26% of that cost to the tune of $23.8 billion, with a giant chunk spent on the first and second launch hardware.

The audit forecasts future SLS launches to cost more than $2.5 billion each, although NASA has laid out a plan to reduce those costs by half, something the OIG deemed “highly unrealistic” and a threat to its deep-space exploration plans. The audit, though, notes that while SLS is the only viable option now for NASA, competition from SpaceX Starship and Blue Origin’s New Glenn rockets may help level the playing field for NASA’s plans.

“Although the SLS is the only launch vehicle capable of transporting both crew and cargo to the moon in a single mission, its high cost threatens the affordability and sustainability of NASA’s Artemis missions,” the audit stated. “The Agency has taken steps to lower production costs by requiring future SLS rockets to be produced with new, non-refurbished RS-25 engines and solid rocket booster segments. NASA also seeks to reduce per-mission costs to $1.5 billion or less, a goal we find highly unrealistic based on current costs.”

In its response, NASA said it would be up to private companies such as SpaceX and Blue Origin to take up the challenge to provide the vehicles for the next missions to deep space with a target of 2040 for humans to land on Mars. Even for now, a version of Starship is slated to provide the human lunar lander for the Artemis III mission.

But for now, the focus is on getting SLS ready for humans to make the trip around the moon and back. Honeycutt said that while there were still a lot of milestones to hit before launch, he expects to be able to meet them.

“We got to stay focused,” he said. “We don’t have the budget to start over. We got to press forward with what we got and make it work.”

Tables

Table 1: Artemis II Mission Details

Aspect Description
Launch Date No earlier than September 2025
Duration 10 days
Astronauts Reid Wiseman, Victor Glover, Christina Koch, Jeremy Hansen
Distance More than 230,000 miles from Earth
Objective Validate Orion’s life-support systems
Next Mission Artemis III (Return humans to the lunar surface)

Table 2: Space Launch System (SLS) Rocket Specifications

Component Specification
Core Stage 212 feet long, 4 RS-25 engines
Solid Rocket Boosters 5 segments each, refurbished from Shuttle Program
Thrust 8.8 million pounds at liftoff
Payload Capacity 95 metric tons to low Earth orbit
Cost Per Launch Over $2.5 billion

Conclusion

The countdown to NASA’s most powerful human spaceflight ever is well underway. With the Artemis II mission, the Space Launch System rocket is set to achieve a historic milestone in space exploration. As NASA prepares to send astronauts around the moon, the success of this mission will pave the way for future lunar landings and the eventual goal of human exploration on Mars. Despite the challenges and costs, the Artemis program represents a bold step forward in humanity’s quest to explore the cosmos.

Hashtags

#NASA, #SpaceLaunchSystem, #ArtemisII, #SpaceExploration, #MoonMission, #HumanSpaceflight, #OrionCapsule, #Astronauts, #SpaceProgram, #FutureMissions

The Science Behind Meteorites Striking the Surface of Mars Daily

Key Takeaway

Meteorites strike the surface of Mars daily, with NASA’s InSight lander and its SEIS instrument providing critical data to understand these impacts. This data has allowed scientists to estimate impact rates, revealing insights into the geological history and potential hazards for future missions.

Summary

  • NASA’s InSight Mars Lander’s SEIS instrument collected seismic data on Mars for over four years.
  • Researchers used this data to determine a new meteorite impact rate for Mars.
  • SEIS detected over 1300 seismic events, with a portion attributed to meteorite impacts.
  • Scientists estimate that 280 to 360 meteoroids, about the size of basketballs, strike Mars each year.
  • This rate is five times higher than previously estimated from orbital imagery.
  • Impact rates help understand the age of Mars’ surface and provide insight into its geological history.
  • The study shows that seismometers are reliable tools for measuring impact rates on Mars.
  • The data has broader implications for understanding impact rates throughout the Solar System.
  • Frequent impacts create significant blast zones, posing potential hazards for future Mars missions.
  • Understanding meteorite impacts on Mars is crucial for the safety and planning of robotic and human missions.

Introduction

Mars, our neighboring red planet, experiences daily meteorite impacts that shape its surface and reveal much about its geological history. NASA’s InSight Mars Lander, equipped with the Seismic Experiment for Interior Structure (SEIS), has provided invaluable data to understand these impacts.

SEIS and Its Mission

NASA’s InSight lander, which arrived on Mars on November 26, 2018, was equipped with several scientific instruments, including SEIS. The primary goal of SEIS was to probe Mars’ interior by measuring seismic waves from marsquakes and meteorite impacts. Over four years, SEIS recorded more than 1300 seismic events, allowing scientists to analyze the frequency and impact of meteoroids on Mars.

The Role of SEIS

  • SEIS: Designed to detect seismic waves caused by marsquakes and meteorite impacts.
  • Placement: Positioned on Mars’ surface on December 19, 2018, and later covered with a protective shell to shield it from wind.
  • Data Collection: Collected seismic data for over four years, recording over 1300 seismic events.

Determining Impact Rates

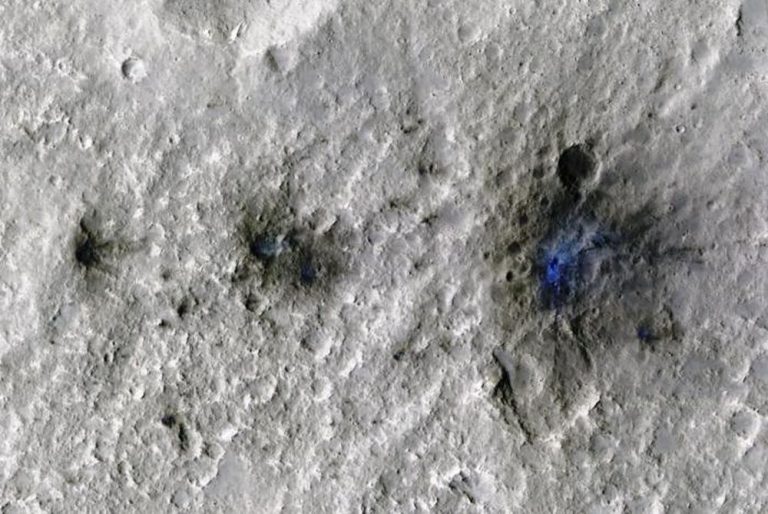
Researchers faced the challenge of distinguishing between seismic events caused by marsquakes and those caused by meteorite impacts. Despite this difficulty, six events near the InSight lander were confirmed as meteorite impacts due to their correlation with acoustic signals produced when meteors entered Mars’ atmosphere. These events helped establish a new estimate for Mars’ impact rates.

Analyzing Seismic Data

  • Confirmed Impacts: Six events were confirmed as meteorite impacts through acoustic signal correlation.
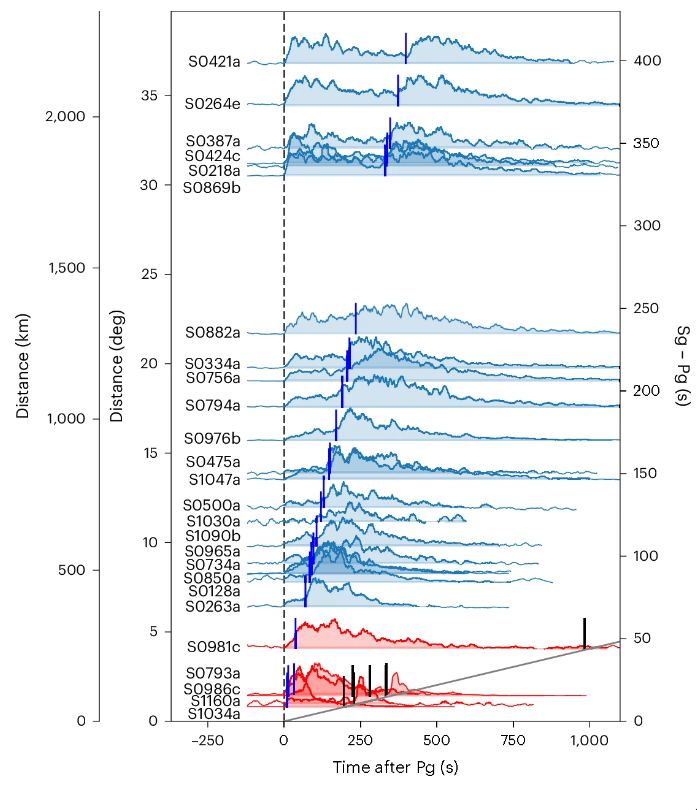
  • VF Events: InSight detected 70 very high-frequency (VF) events, with 59 having good distance estimates.
  • Impact Quakes: Impact-generated quakes are characterized by shorter durations compared to typical marsquakes.
This figure from the research shows envelopes of recorded VF quality B events sorted by distance. The graph plots data from 120 seconds before to 1,100 seconds after the event. The events are aligned by their first signal (Pg) arrival. The blue lines represent the second signal arrival (Sg.) The six red events are confirmed impact events. For those impact events, the black lines show where the “chirp” signal arrives. The chirp signal is a unique marker that indicates an impact event has occurred. Image Credit: Zenhäusern, Wójcicka et al. 2024.

New Impact Rate Estimate

The data from SEIS led to a significant finding: Mars experiences between 280 and 360 meteoroid impacts annually, creating craters greater than 8 meters in diameter. This rate is five times higher than previous estimates based on orbital imagery alone, highlighting the effectiveness of seismology in measuring impact rates.

Impact Frequency and Crater Formation

  • Impact Rate: Between 280 and 360 meteoroids strike Mars each year, forming craters larger than 8 meters.
  • Comparison: This rate is five times higher than estimates from orbital images.
  • Crater Size: Larger craters are formed almost daily, with significant blast zones around them.

Implications for Geological History

Impact rates are crucial for understanding the geological history of planetary surfaces. Earth’s surface is constantly reshaped by geological activity, but bodies like the Moon and Mars rely on impact rates to determine surface ages. Mars’ impact rate provides insights into its geological history and helps compare it with other celestial bodies.

Understanding Surface Ages

  • Surface Ages: Impact rates help determine the age of planetary surfaces.
  • Comparison: Mars’ impact rate can be compared with data from the Moon and other bodies.
  • Geological History: Provides a deeper understanding of Mars’ geological history.
NASA's InSight lander put its seismometer on Mars on December 19, 2018. They called this seismometer SEIS. Later, they covered SEIS with a protective shell. This shell protects it from wind. Image Credit: NASA/JPL-Caltech
NASA’s InSight lander put its seismometer on Mars on December 19, 2018. They called this seismometer SEIS. Later, they covered SEIS with a protective shell. This shell protects it from wind. Image Credit: NASA/JPL-Caltech

Challenges in Measuring Impact Rates

Accurately measuring impact rates on Mars presents challenges due to its unique environment. Mars’ gravity, proximity to the asteroid belt, and frequent dust storms complicate observations. Seismology, as demonstrated by SEIS, offers a more reliable method to overcome these challenges.

Factors Affecting Impact Rate Measurement

  • Gravity: Mars’ gravity influences the number of meteoroids striking its surface.
  • Asteroid Belt: Proximity to the asteroid belt increases the frequency of meteoroids.
  • Dust Storms: Dust storms can obscure craters, making orbital observations difficult.
  • Surface Types: Varied surface regions affect the visibility of craters.

Broader Implications for the Solar System

Understanding Mars’ impact rate extends beyond the red planet. It provides valuable data for the entire Solar System, helping to determine the absolute ages of surfaces and offering insights into the history of other celestial bodies.

Solar System Impact Rates

  • Solar System: Mars’ impact rate helps determine surface ages throughout the Solar System.
  • Historical Insights: Offers a clearer understanding of the Solar System’s history.

Safety Considerations for Future Missions

The high frequency of meteorite impacts on Mars poses potential hazards for future robotic and human missions. Understanding these impacts is crucial for mission planning and ensuring the safety of equipment and personnel.

Mission Planning and Safety

  • Hazards: Frequent impacts and large blast zones pose risks.
  • Planning: Accurate impact rate data is essential for safe mission planning.
  • Future Missions: Ensures the safety of robotic and human explorers.
This figure from the research shows crater size and seismic moment for the six confirmed impacts near the InSight lander. Circles show single craters. Triangles show the effective diameter of crater clusters. The vertical error bars show the uncertainty in seismic moment magnitude. This magnitude is calculated using standard error propagation techniques. The horizontal error bars come from the resolution of HiRISE images. These images are used to determine the crater sizes. Image Credit: Zenhäusern, Wójcicka et al. 2024.

Conclusion

NASA’s InSight Mars Lander and its SEIS instrument have revolutionized our understanding of meteorite impacts on Mars. The data collected over four years has provided a new estimate for impact rates, revealing that Mars experiences almost daily impacts. This information is vital for understanding Mars’ geological history, planning future missions, and ensuring the safety of explorers.

Tables

Table 1: SEIS Data Summary

Parameter Value
Total Seismic Events 1300+
Confirmed Meteorite Impacts 6
VF Events 70
Annual Impact Rate 280-360 meteoroids
Crater Size (Daily) >8 meters
Crater Size (Monthly) ~30 meters

Table 2: Impact Rate Comparison

Method Estimated Impact Rate (Annual)
Orbital Imagery ~60-70
Seismology (SEIS) 280-360
Increase Factor 5x

Hashtags

#Mars, #NASA, #InSight, #SEIS, #MeteoriteImpacts, #MarsExploration, #Seismology, #SpaceScience, #AsteroidBelt, #FutureMissions, #GeologicalHistory, #SolarSystem, #SpaceSafety, #PlanetaryScience

High-Speed Internet on the Space Station: What It Means for Astronauts

Key Takeaway

NASA’s Space Communications and Navigation (SCaN) program has revolutionized space communication with the introduction of the first two-way, end-to-end laser relay system. This technology significantly enhances data transmission speeds, improves communication reliability, and reduces power consumption on the International Space Station (ISS).

Summary

  • SCaN Program: Developed by NASA, demonstrating advanced laser communication technology.
  • Laser Relay System: First two-way end-to-end laser relay system tested with a 1.2 Gbps speed.
  • ILLUMA-T: Integrated LCRD Low Earth Orbit User Modem and Amplifier Terminal.
  • DTN and HDTN: Delay/Disruption Tolerant Networking and High-Rate Delay Tolerant Networking to manage data disruptions and enhance speed.
  • Pet Imagery: Astronauts used the system to send images and videos of pets as part of the test.
  • Advantages of Laser Communication: Faster data transmission, smaller and lighter equipment, and reduced power consumption.
  • Future Implications: Enhancing communications for NASA’s Artemis program and future interplanetary missions.
A collage of the pet photos. These were sent over laser links from Earth to LCRD (Laser Communications Relay Demonstration). Then, they were sent to ILLUMA-T (Integrated LCRD Low Earth Orbit User Modem and Amplifier Terminal) on the space station. Credit: NASA/Dave Ryan

High-Speed Internet on the Space Station: What It Means for Astronauts

NASA’s Space Communications and Navigation (SCaN) program has achieved a groundbreaking milestone by demonstrating the first two-way, end-to-end laser relay system. This innovative technology was tested by sending data to the International Space Station (ISS) at an astonishing speed of 1.2 gigabits per second. Using this high-speed internet, a set of images and videos of pets belonging to NASA astronauts and staffers were transmitted, showcasing the system’s capabilities. This advancement promises to revolutionize communications in space, enhancing the working and living environment for astronauts on the ISS and beyond.

The SCaN Program and Laser Relay System

The SCaN program, spearheaded by NASA, focuses on advancing space communication technologies. The recent test of the two-way end-to-end laser relay system is a significant leap forward. Traditionally, NASA has relied on radio frequency communications for data transfer. However, the breakthrough in laser communications, also known as optical communications, allows for the transfer of more complex messages and data packets much more quickly. Both radio waves and infrared light travel at the speed of light, but infrared light, used in laser communications, moves in a tighter wavelength, enabling rapid modulation of signals and hence faster data transfer.

Testing the System with Pet Imagery

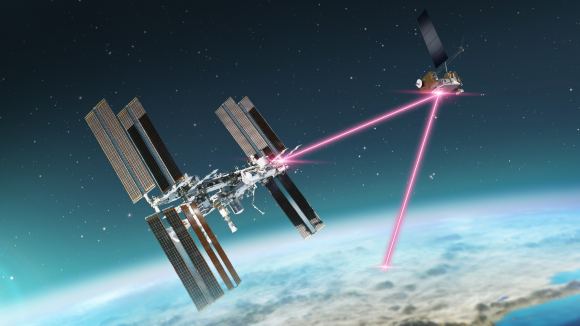
A group of NASA astronauts and employees, including Randy Bresnik, Cristina Koch, and Kjell Lindgren, selected the pet imagery as the test dataset. These full-color images and videos are more complex due to their high pixel count, making them ideal for demonstrating the speed and agility of the Integrated LCRD Low Earth Orbit User Modem and Amplifier Terminal (ILLUMA-T) system. The data journey began at a mission operations center in Las Cruces, New Mexico, before being routed to optical ground stations in California and Hawaii. From there, the data was modulated onto infrared laser signals and sent to NASA’s Laser Communications Relay Demonstration (LCRD) satellite in geosynchronous orbit, which then relayed the data to the ILLUMA-T on the space station.

Addressing Space Communication Challenges with DTN and HDTN

Space data transmission often faces significant delays and potential data loss due to the vast distances involved. To overcome these challenges, NASA developed Delay/Disruption Tolerant Networking (DTN), which uses a “store-and-forward” process to manage data disruptions. An advanced version called High-Rate Delay Tolerant Networking (HDTN), developed by NASA’s Glenn Research Center, enhances this process, enabling data transfer up to four times faster than current DTN technology. HDTN aggregates data from various sources and prepares it for transmission back to Earth, as demonstrated during the pet photo and video experiment.

Advantages of Laser Communication for Astronauts

Laser communication technology offers several advantages over traditional radio frequency systems:

  1. Speed: With data transmission speeds reaching 1.2 gigabits per second, laser communication allows for faster transfer of large data sets, including high-definition multimedia.
  2. Efficiency: The ILLUMA-T laser communication terminal is smaller, lighter, and requires less power than existing systems, which frees up space and resources on the ISS.
  3. Reliability: Enhanced DTN and HDTN technologies improve the reliability of communications, reducing the risk of data loss.
  4. Bandwidth: The increased bandwidth capacity supports more complex and data-heavy communications, crucial for future space missions.

Kevin Coggins, the deputy associate administrator and SCaN program manager at NASA, highlighted the success of the demonstration, stating, “Not only have they demonstrated how these technologies can play an essential role in enabling NASA’s future science and exploration missions, but it also provided a fun opportunity for the teams to ‘picture’ their pets assisting with this innovative demonstration.”

A collage of the pet photos was sent over laser links from Earth to LCRD (Laser Communications Relay Demonstration) to ILLUMA-T (Integrated LCRD Low Earth Orbit User Modem and Amplifier Terminal) on the space station. NASA/Molly Kearns

Historical Context and Future Implications

Historically, NASA’s reliance on radio frequency communications has been adequate but limiting in terms of data volume and speed. The transition to laser communications marks a significant improvement, not only for the current operations on the ISS but also for future missions. For instance, during a December 2023 test, a 15-second HD video of a cat named “Taters” chasing a laser pointer was streamed from the Psyche spacecraft almost 30 million kilometers away to the Hale Telescope at the Palomar Observatory in California. This test illustrated the potential of high-bandwidth laser communications in deep space, taking just 101 minutes to complete.

Enhancing Future Space Missions

The optimized DTN technology aims to enhance NASA’s communications services, including improved security, network routing of high-definition multimedia, and more. As NASA’s Artemis program advances toward establishing a sustainable lunar presence, SCaN continues to develop innovative communications technology to bring the reliability and performance of Earth’s internet to space. The ILLUMA-T, LCRD, and HDTN technologies, funded by NASA’s SCaN program at NASA Headquarters, are managed by NASA’s Goddard Space Flight Center and Glenn Research Center. The space station network is managed by NASA’s Johnson Space Center and Marshall Space Flight Center.

Tables and Detailed Analysis

Table 1: Comparison of Radio Frequency and Laser Communications
Feature Radio Frequency Communications Laser Communications
Speed Moderate High (up to 1.2 Gbps)
Wavelength Broad Narrow (infrared light)
Data Capacity Limited High
Equipment Size Larger Smaller
Power Consumption Higher Lower
Reliability Moderate High (with DTN/HDTN)

Table 2: Key Technologies in NASA’s SCaN Program

Technology Description Advantages
ILLUMA-T Integrated LCRD Low Earth Orbit User Modem and Amplifier Terminal Smaller, lighter, reduced power consumption, faster data transmission
LCRD Laser Communications Relay Demonstration Demonstrates feasibility and efficiency of laser communications
DTN Delay/Disruption Tolerant Networking Manages data disruptions, uses “store-and-forward” process
HDTN High-Rate Delay Tolerant Networking Enhances DTN, aggregates data, enables up to four times faster data transfer

Conclusion

The successful demonstration of NASA’s first two-way, end-to-end laser relay system marks a pivotal advancement in space communication technology. By leveraging high-speed laser communications, the SCaN program has showcased the potential to significantly enhance data transfer capabilities, improve reliability, and reduce power consumption on the ISS. This innovation not only facilitates better communication for current missions but also lays the groundwork for future space exploration, including NASA’s Artemis program and interplanetary missions.

The collaborative efforts of NASA’s Goddard Space Flight Center, Glenn Research Center, Johnson Space Center, and Marshall Space Flight Center ensure that these advanced technologies will continue to evolve, bringing the reliability and performance of Earth’s internet to space. As Kevin Coggins aptly put it, the success of these demonstrations “provided a fun opportunity for the teams to ‘picture’ their pets assisting with this innovative demonstration,” underscoring the blend of technological advancement and human connection at the heart of space exploration.

References

Hashtags

#NASA, #SpaceStation, #LaserCommunication, #SCaN, #ILLUMA, #HDTN, #SpaceExploration, #HighSpeedInternet, #FutureMissions, #Technology

The Science Behind Liquid Water on Mars: Missions to Mars.

Key Takeaway

Understanding the presence and accessibility of liquid water on Mars is crucial for the success of future crewed missions. Despite some recent findings, the existence of liquid water on Mars remains a subject of debate.

Summary

  • NASA and China are planning crewed missions to Mars in the coming decades.
  • In-situ resource utilization (ISRU) is essential for sustaining astronauts on Mars.
  • Historical missions have revealed surface features suggesting past water flow on Mars.
  • ESA’s Mars Express detected bright radar reflections beneath the southern polar ice cap.
  • The MARSIS instrument found bright patches that could indicate liquid water.
  • Recent research suggests these reflections might be due to ice composition and layer thickness.
  • Liquid water on Mars would need to be very briny or heated by magma.
  • Future missions might need to rely on ice deposits or chemical reactions for water.
  • Findings about Mars’s geological activity suggest it may still be geologically active.
  • The possibility of microbial life existing on Mars remains a tantalizing prospect.

The Science Behind Liquid Water on Mars: Missions to Mars

In the coming decades, NASA and China intend to send the first crewed missions to Mars. Given the distance involved and the time it takes to make a single transit (six to nine months), opportunities for resupply missions will be few and far between. As a result, astronauts and taikonauts will be forced to rely on local resources to meet their basic needs – a process known as in-situ resource utilization (ISRU). For this reason, NASA and other space agencies have spent decades scouting for accessible sources of liquid water.

Finding this water is essential for future missions and scientific efforts to learn more about Mars’s past, when the planet was covered by oceans, rivers, and lakes that may have supported life. In 2018, using ground-penetrating radar, the ESA’s Mars Express orbiter detected bright radar reflections beneath the southern polar ice cap that were interpreted as a lake. However, a team of Cornell researchers recently conducted a series of simulations that suggest there may be another reason for these bright patches that do not include the presence of water.

Historical Evidence of Water on Mars

When the first robotic probes began making flybys of Mars in the 1960s, the images they acquired revealed surface features common on Earth. These included flow channels, river valleys, lakebeds, and sedimentary rock, all of which form in the presence of flowing water. For decades, orbiters, landers, and rovers have explored Mars’ surface, atmosphere, and climate to learn more about how and when much of this surface water was lost. In recent years, this has led to compelling evidence that what remains could be found beneath the polar ice caps today.

The most compelling evidence was obtained by the Mars Advanced Radar for Subsurface and Ionosphere Sounding (MARSIS) instrument aboard the Mars Express orbiter. This instrument was designed by NASA and the Italian Space Agency (ASI) to search for water on the Martian surface and down to depths of about 5 km (3 mi). The radar returns indicated that the bright patches could be caused by layered deposits composed of water, dry ice, and dust. These South Polar Layered Deposits (SPLD) are thought to have formed over millions of years as Mars’ axial tilt changed.

Subsequent research by scientists at NASA’s Jet Propulsion Laboratory (JPL) revealed dozens of other highly reflective sites beneath the surface. The implications of these findings were tremendous, not just for crewed missions but also for astrobiology efforts. In addition to being a potential source of water for future missions, it was also theorized that microbial life that once existed on the surface might be found there today. However, the findings were subject to debate as other viable explanations were offered.

The Debate on Liquid Water

While the same bright radar reflections have detected subglacial lakes on Earth (such as Lake Vostok under the East Antarctic Ice Sheet), Mars’s temperature and pressure conditions are very different. To remain in a liquid state, the water would need to be very briny, loaded with exotic minerals, or above an active magma chamber – none of which have been detected. As Lalich said in a recent interview with the Cornell Chronicle:

Research and Simulations

In a previous study, Lalich and his colleagues used simpler models to demonstrate that these bright radar signals could result from tiny variations in the thickness of the layers. These variations would be indiscernible to ground-penetrating radar and could lead to constructive interference between radar waves, producing reflections that vary in intensity and variability – like those observed across the SPLD. For their latest study, the team simulated 10,000 layering scenarios with 1,000 variations in the ice thickness and dust content of the layered deposits.

Their simulations also excluded any of the unusual conditions or exotic materials that would be necessary for liquid water. These simulations produced bright subsurface signals consistent with observations made by the MARSIS instrument. According to Lalich, these findings strongly suggest that he and his colleagues were correct in suspecting radar interference. In essence, radar waves bouncing off of layers too close together for the instrument to resolve may have combined, amplifying their peaks and troughs and appearing much brighter.

Implications for Future Missions

The team is not prepared to rule out the possibility that future missions with more sophisticated instruments could find definitive evidence of water. However, Lalich suspects that the case for liquid water (and potential life) on Mars may have ended decades ago.

If so, future missions may be forced to melt polar ice deposits and permafrost to get drinking water or possibly chemical reactions involving hydrazine (a la Mark Watney). In addition, astrobiology efforts may once again be placed on the back burner as they were when the Viking Landers failed to find conclusive evidence of biosignatures in 1976. But as we’ve learned, Mars is full of surprises. While the results of the Viking biological experiments were disappointing, these same missions provided some of the most compelling evidence that water once flowed on Mars’ surface.

Mars’ Geological Activity

Moreover, scientists once suspected that the Red Planet was geologically dead, but data obtained by NASA’s InSight Lander showed that it is actually “slightly alive.” This included evidence that hot magma still flows deep in the planet’s interior and that a massive magma plume still exists beneath the Elysium Planitia region, which may have caused a small eruption just 53,000 years ago (the most recent in Martian history). Perhaps the same will hold true for briny patches of liquid water around the poles and the equatorial region.

Potential for Microbial Life

With any luck, some of these patches may even house countless microorganisms that could be related to life on Earth. The possibility of finding life on Mars, even if it is microbial, would have profound implications for our understanding of biology and the potential for life elsewhere in the universe. How cool would that be?

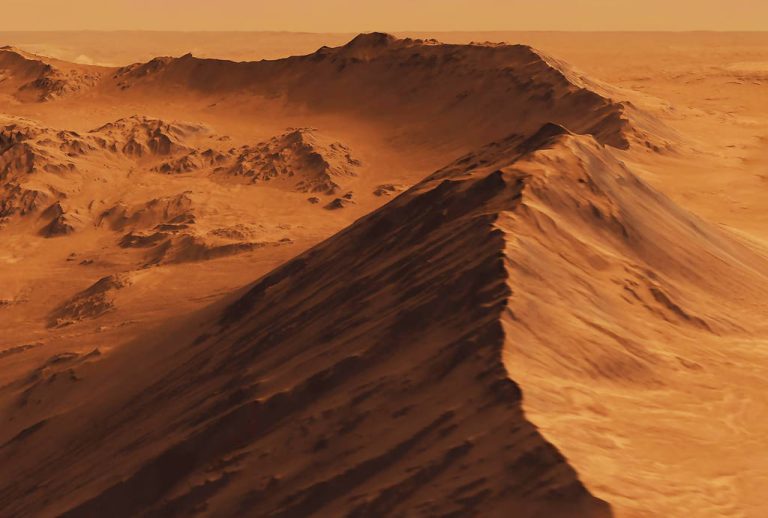
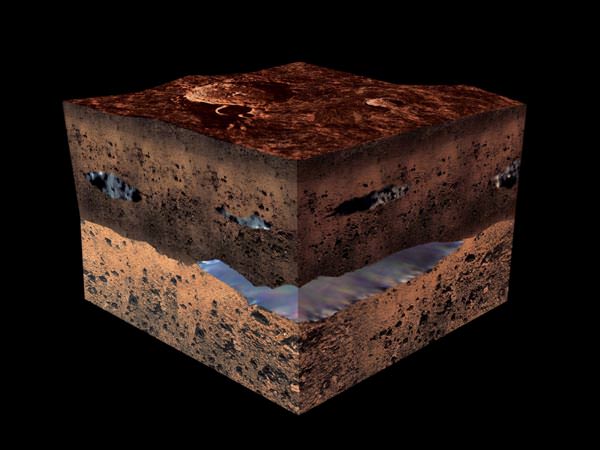
Artist’s impression of water under the Martian surface. If underground aquifers exist, the implications for human exploration and eventual settlement of the Red Planet would be far-reaching. Credit: ESA

Tables and Data

Table 1: Key Mars Missions and Discoveries

Mission Year Launched Key Discovery
Mariner 4 1964 First images of Mars, surface features
Viking 1 & 2 1975 Search for biosignatures, evidence of water flow
Mars Global Surveyor 1996 Detailed maps of Mars surface, climate
Mars Odyssey 2001 Detection of water ice beneath the surface
Mars Express 2003 Evidence of water beneath polar ice caps
Curiosity Rover 2011 Study of Mars’ habitability, organic molecules
InSight Lander 2018 Mars’ seismic activity, interior structure

Table 2: Comparison of Earth and Mars Conditions

Condition Earth Mars
Atmospheric Pressure 101.3 kPa (at sea level) ~0.6 kPa
Surface Temperature -88°C to 58°C -125°C to 20°C
Presence of Water Abundant in liquid form Mostly in ice, traces of vapor
Geologic Activity Active Slightly active, recent magma

Conclusion

The quest to find liquid water on Mars is ongoing and fraught with challenges. While recent findings cast doubt on the presence of liquid water, the pursuit has led to a deeper understanding of the planet’s geology and climate. Future missions will continue to explore this enigmatic planet, with the hope of uncovering the secrets that lie beneath its surface. Whether or not we find liquid water, the journey itself will expand our knowledge and pave the way for human exploration.

References

Hashtags

#Mars, #NASA, #MarsMissions, #LiquidWater, #SpaceExploration, #Astrobiology #Geology, #InSituResourceUtilization, #FutureMissions, #ScienceAdvances

About The Moon Today: Breakthroughs in Creating Detailed Lunar Maps

Key Takeaways

Researchers at Brown University have enhanced the technique of creating lunar maps using satellite images. The advanced method, known as ‘shape-from-shading’, analyzes shadows to estimate terrain features and shapes. Detailed lunar maps are critical for safe and efficient future lunar missions. The Artemis project, aiming for the Moon’s south pole, will benefit greatly from these high-resolution maps. New algorithms automate image alignment and quality control, significantly improving map accuracy.

Summary

  • Enhanced Technique: Brown University researchers improved the ‘shape-from-shading’ method for creating lunar maps.
  • Importance of Maps: High-resolution maps are crucial for lunar missions to identify safe landing sites and areas of interest.
  • Automation and Accuracy: Advanced algorithms automate the process, align images accurately, and filter poor-quality images.
  • Validation: The new technique produces more precise maps compared to traditional methods.
  • Future Missions: Projects like Artemis will benefit from these detailed maps, especially in poorly mapped areas like the Moon’s south pole.

Breakthroughs in Creating Detailed Lunar Maps

There was a time when maps of the Moon were created from telescopic observations and drawings. Indeed, Sir Patrick Moore created maps of the Moon that were used during the historic Apollo landings. Today, researchers have developed a sophisticated technique to create accurate maps from existing satellite images. This approach, known as ‘shape-from-shading’, involves analyzing shadows to estimate the features and shape of the terrain. Future lunar missions will be able to use these maps to identify hazards on the surface, making them far safer.

Advancements at Brown University

Researchers at Brown University in Rhode Island have refined the process used to map the surface of the Moon, making it more accurate than ever before. Their paper, published in the Planetary Science Journal and authored by Benjamin Boatwright and his team, details the enhancements to the mapping technique. This technique can generate detailed models of the Moon’s surface to highlight craters, ridges, and slopes from composites of 2D images.

Highly detailed maps are of crucial importance to lunar missions as they help planners identify the safest places to land. They can also pinpoint areas of particular interest that require further study, enabling the entire mission to be far more efficient. Missions such as the Artemis project will benefit significantly when it heads for the south pole of the Moon, an area that is not well mapped. High-resolution maps of this region will aid autonomous landing systems in avoiding hazards.

Challenges and Solutions

Creating these maps is a time-consuming job and is particularly challenging when lighting levels in the target area are poor. Previously, the interpretation of shadows was less effective, but the team at Brown University addressed these issues. In their paper, they explain how advanced computer algorithms can automate much of the process and improve the resolution of the generated models. Their new software provides lunar astronomers with the necessary tools and information to create larger, more detailed maps of the surface.

To allow lunar scientists to create a map from images, at least two images of the same area are required. Each image must be perfectly aligned with its counterpart so that features in one are in the exact same place in the other. Until now, the technology has not been able to take multiple images of an area and create a perfect map. Boatwright stated, “We implemented an image alignment algorithm where it picks out features in one image and tries to find those same features in the other and then line them up, so that you’re not having to sit there manually tracing interest points across multiple images, which takes a lot of hours and brainpower.”

Along with the image alignment algorithm, the researchers created quality control algorithms and filters to remove poor-quality images from the alignment process. By only inputting high-quality images into the process, the output is of far higher quality. This approach is similar to astronomical imaging, which processes multiple images through stacking and alignment techniques.

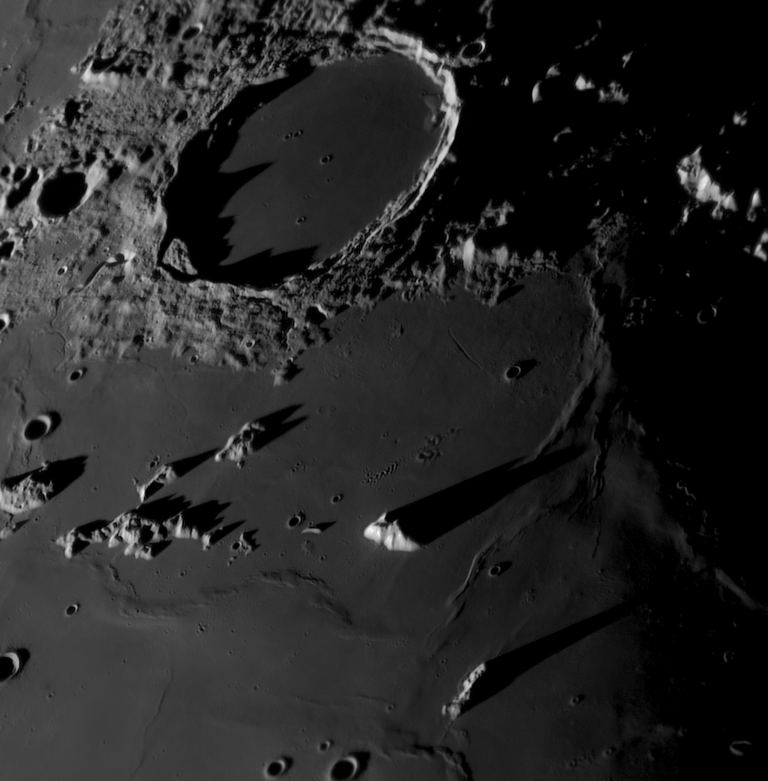
Lunar surface in close detail (Image credit NASA)

Table 1: Key Improvements in Lunar Mapping Techniques

Improvement Description
Shape-from-shading Analyzes shadows to estimate terrain features and shapes
Image alignment Uses algorithms to perfectly align multiple images of the same area
Quality control Filters out poor-quality images to enhance the final output
Automation Advanced software automates much of the mapping process

Validation and Future Applications

To evaluate the accuracy of their work, the team compared the output from existing maps of the Moon to look for errors. To their delight, they found that maps created using their enhanced ‘shape-from-shading’ technique were more precise compared to those produced using traditional techniques.

Table 2: Comparison of Traditional vs. Enhanced Mapping Techniques

Feature Traditional Technique Enhanced ‘Shape-from-shading’ Technique
Image quality Varied, manual selection Automated selection of high-quality images
Image alignment Manual tracing of features Automated algorithm-based alignment
Shadow interpretation Less effective Highly effective
Map accuracy Lower precision Higher precision

Importance of Detailed Lunar Maps

The creation of highly detailed lunar maps is not just a technological achievement but a necessity for the future of lunar exploration. These maps play a crucial role in ensuring the safety and efficiency of lunar missions. They help mission planners identify safe landing sites, avoiding hazards such as large boulders or deep craters. Additionally, they enable scientists to locate areas of scientific interest, such as regions with unusual geological formations or potential resources like water ice.

Impact on Future Lunar Missions

The Artemis project, which aims to return humans to the Moon and establish a sustainable presence, will greatly benefit from these detailed maps. The south pole of the Moon, a region of particular interest due to its potential water ice deposits, is not well mapped. High-resolution maps of this area will be invaluable for the mission’s autonomous landing systems, helping them to avoid hazards and select the safest landing sites.

Moreover, detailed maps will aid in the planning of future lunar bases. Understanding the terrain is crucial for selecting locations for habitats, scientific instruments, and other infrastructure. By providing accurate and detailed maps, researchers can ensure that these bases are built in optimal locations, maximizing safety and efficiency.

Conclusion

The breakthroughs in creating detailed lunar maps represent a significant advancement in lunar exploration. The enhanced ‘shape-from-shading’ technique developed by researchers at Brown University, along with advanced algorithms for image alignment and quality control, have resulted in maps with unprecedented detail and accuracy. These maps are crucial for the success of future lunar missions, ensuring safe landings and efficient exploration of the Moon’s surface.

References

  1. Researchers at Brown University have developed a new technique. This technique offers more precise maps of the Moon’s surface.
  2. Boatwright, B., et al. (2024). Enhanced Lunar Mapping Techniques. Science Times.
  3. NASA. (2024). Artemis Mission Overview.
  4. Brown University. (2024). Advancements in Lunar Mapping Research.
  5. Moore, P. (1969). Lunar Mapping for Apollo Missions.

Hashtags

#LunarMapping, #ShapeFromShading, #MoonExploration, #ArtemisMission, #BrownUniversity, #NASA, #LunarResearch, #SpaceExploration, #FutureMissions, #LunarSafety

Pin It
error: Content is protected !!

This website utilizes first- and third-party tools that store small files (cookies) on your device. These cookies serve various purposes, including ensuring the site functions correctly (technical cookies), analyzing site usage (analytics cookies), and delivering relevant advertisements (profiling cookies). While technical cookies are essential and used by default, you have the option to enable or disable analytics and profiling cookies. By allowing these cookies, you help us enhance your browsing experience.