Clean Energy Breakthrough: Scientists Crack Artificial Photosynthesis Code
A revolutionary development in artificial photosynthesis has been achieved by scientists, marking a significant step toward harnessing solar energy for clean fuel production and carbon capture. This breakthrough promises an innovative path to reduce our reliance on fossil fuels and combat climate change.
Summary:
- Introduction to Artificial Photosynthesis: Overview of the natural process and its inspiration.
- Scientific Breakthrough: Detailed explanation of the stacked dye system mimicking plant cells.
- Research Collaboration: International teams working together to expand the technology.
- Technological Advantages: Fast energy transport and efficient charge separation using light.
- Future Prospects: The goal to develop supramolecular wires for enhanced energy transfer.
- Comparative Analysis: Side-by-side look at natural versus artificial photosynthesis.
- Fun Facts & References: Engaging trivia and hyperlinks to authoritative sources.
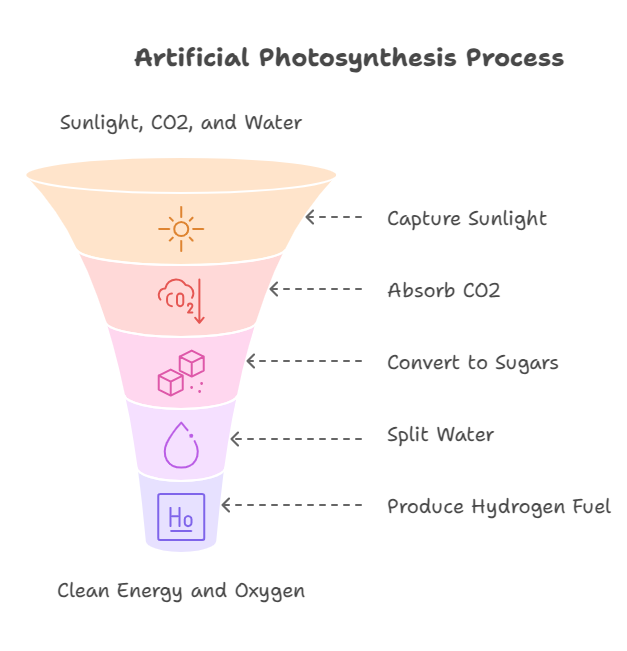
Introduction
Clean energy is one of the most critical challenges of our time. Scientists are exploring innovative ways to replace fossil fuels and lower carbon emissions. One such method is artificial photosynthesis—a process that mimics nature’s way of converting sunlight into energy. By replicating the natural mechanism of plants, researchers hope to generate renewable energy and create new methods for carbon capture. This breakthrough could be a game-changer in our quest for sustainable energy solutions.
Understanding Natural Photosynthesis
Natural photosynthesis is the process by which plants convert sunlight, water, and carbon dioxide into oxygen and energy-rich sugars. This process, fundamental to life on Earth, not only fuels plant growth but also supports all aerobic life by providing oxygen. The intricacy of photosynthesis lies in its reliance on pigments, proteins, and a series of biochemical reactions that have evolved over millions of years.
In simple terms, natural photosynthesis begins when chlorophyll in the plant cells absorbs sunlight. This energy is then used to split water molecules, releasing oxygen and generating electrons and protons that help form sugars. The efficiency and sustainability of this process inspire scientists to replicate it in the lab to create cleaner energy solutions.
Breakthrough in Artificial Photosynthesis
Recently, researchers at JMU Würzburg have made significant progress in artificial photosynthesis. Their work involves creating a stacked dye system that mimics the energy transport seen in natural photosynthesis. This system uses a series of dye molecules arranged in a stack that absorbs light and efficiently transfers energy, much like the photosynthetic apparatus in plant cells.
The stacked dye system absorbs light at one end, triggering a series of events that separate charge carriers and transport electrons step by step. This method not only demonstrates a remarkable similarity to natural photosynthesis but also offers the potential to develop new photofunctional materials for clean energy applications.
Table 1: Key Characteristics of the Stacked Dye System
| Feature | Description |
|---|---|
| Light Absorption | Uses stacked dye molecules to capture sunlight, similar to the chlorophyll in plants. |
| Charge Separation | Efficiently separates charge carriers to enable the conversion of light energy into chemical energy. |
| Energy Transfer | Transfers electrons step-by-step, ensuring minimal energy loss during the process. |
| Material Class | Based on perylene bisimide dyes, known for their stability and high performance in light absorption. |
This table outlines the essential features of the stacked dye system, showcasing its similarity to natural processes and its potential to revolutionize energy conversion.
The Stacked Dye System in Detail
The breakthrough involves synthesizing a stack of four dye molecules from the perylene bisimide class. This arrangement closely mirrors the light-harvesting complexes in plant cells. When light strikes the dye stack, it triggers the movement of charge carriers—electrons that hop along the stack in a highly efficient manner.
Researchers observed that the system could be specifically triggered by light, initiating a rapid charge transport process. This efficiency in transferring energy is critical to developing a working model of artificial photosynthesis. The success of this experiment provides a promising step towards the development of clean hydrogen fuel and valuable chemical compounds from carbon dioxide.

Table 2: Comparative Analysis of Energy Transport
| Aspect | Natural Photosynthesis | Artificial Photosynthesis (Dye Stack) |
|---|---|---|
| Energy Capture | Chlorophyll absorbs sunlight | Perylene bisimide dyes absorb light |
| Charge Separation | Water molecules are split to create electrons | Dye molecules initiate charge separation |
| Energy Transport | Electrons travel through complex biochemical pathways | Electrons hop through a series of stacked dyes |
| Output | Produces sugars and oxygen, supporting life | Potential to produce hydrogen fuel and convert CO₂ into useful chemicals |
This table compares the fundamental steps of natural photosynthesis with the new artificial method, highlighting the similarities and innovations in the approach.
The development of this innovative system is a result of collaborative research between teams from JMU Würzburg and Yonsei University in South Korea. International partnerships like these play a crucial role in driving scientific innovation. By combining expertise from different research backgrounds, the scientists have overcome significant challenges in replicating nature’s most efficient energy process.
This breakthrough is more than just an academic achievement; it is a significant stride towards a sustainable future. Artificial photosynthesis holds the promise of reducing greenhouse gas emissions by converting carbon dioxide into useful compounds. If the technology can be scaled up, it could provide a renewable source of hydrogen fuel—one of the cleanest energy carriers available today.
The potential applications of artificial photosynthesis are vast. For example, industries could adopt this technology to create eco-friendly fuels, reduce their carbon footprint, and contribute to a cleaner environment. Moreover, the process of converting CO₂ into valuable chemicals could help mitigate climate change by lowering the concentration of greenhouse gases in the atmosphere.
Innovations in clean energy technologies like this one are vital in the global fight against climate change. As nations seek alternatives to fossil fuels, the development of efficient and scalable artificial photosynthesis systems offers a beacon of hope for a greener planet.
The implications of this research extend to various sectors including energy production, transportation, and manufacturing. Clean hydrogen fuel produced via artificial photosynthesis could revolutionize the energy industry. Moreover, the process of carbon capture embedded in the technology provides an innovative way to address environmental concerns.
Industries are closely watching these developments. As the technology matures, companies involved in renewable energy and green technology might adopt these methods to enhance their sustainability practices. The simplicity and efficiency of the stacked dye system make it a promising candidate for large-scale applications.
The success of the project has led to increased funding and interest in further research, setting the stage for more breakthroughs in the near future. With continued support and collaboration, artificial photosynthesis could soon transition from experimental laboratories to commercial applications, providing a practical solution to global energy challenges.
Facts
- Artificial photosynthesis could one day allow cities to generate their own clean fuel from sunlight and air.
- The inspiration behind the technology comes directly from the way plants convert sunlight into energy.
- Future iterations may see the use of advanced materials that mimic even more closely the complex systems found in nature.
References
For more detailed information on the research and its implications, please refer to the original study published in Nature Chemistry.


